29
/
en
AIzaSyAYiBZKx7MnpbEhh9jyipgxe19OcubqV5w
April 1, 2024
80823
Belarus
BLR
true
2
1
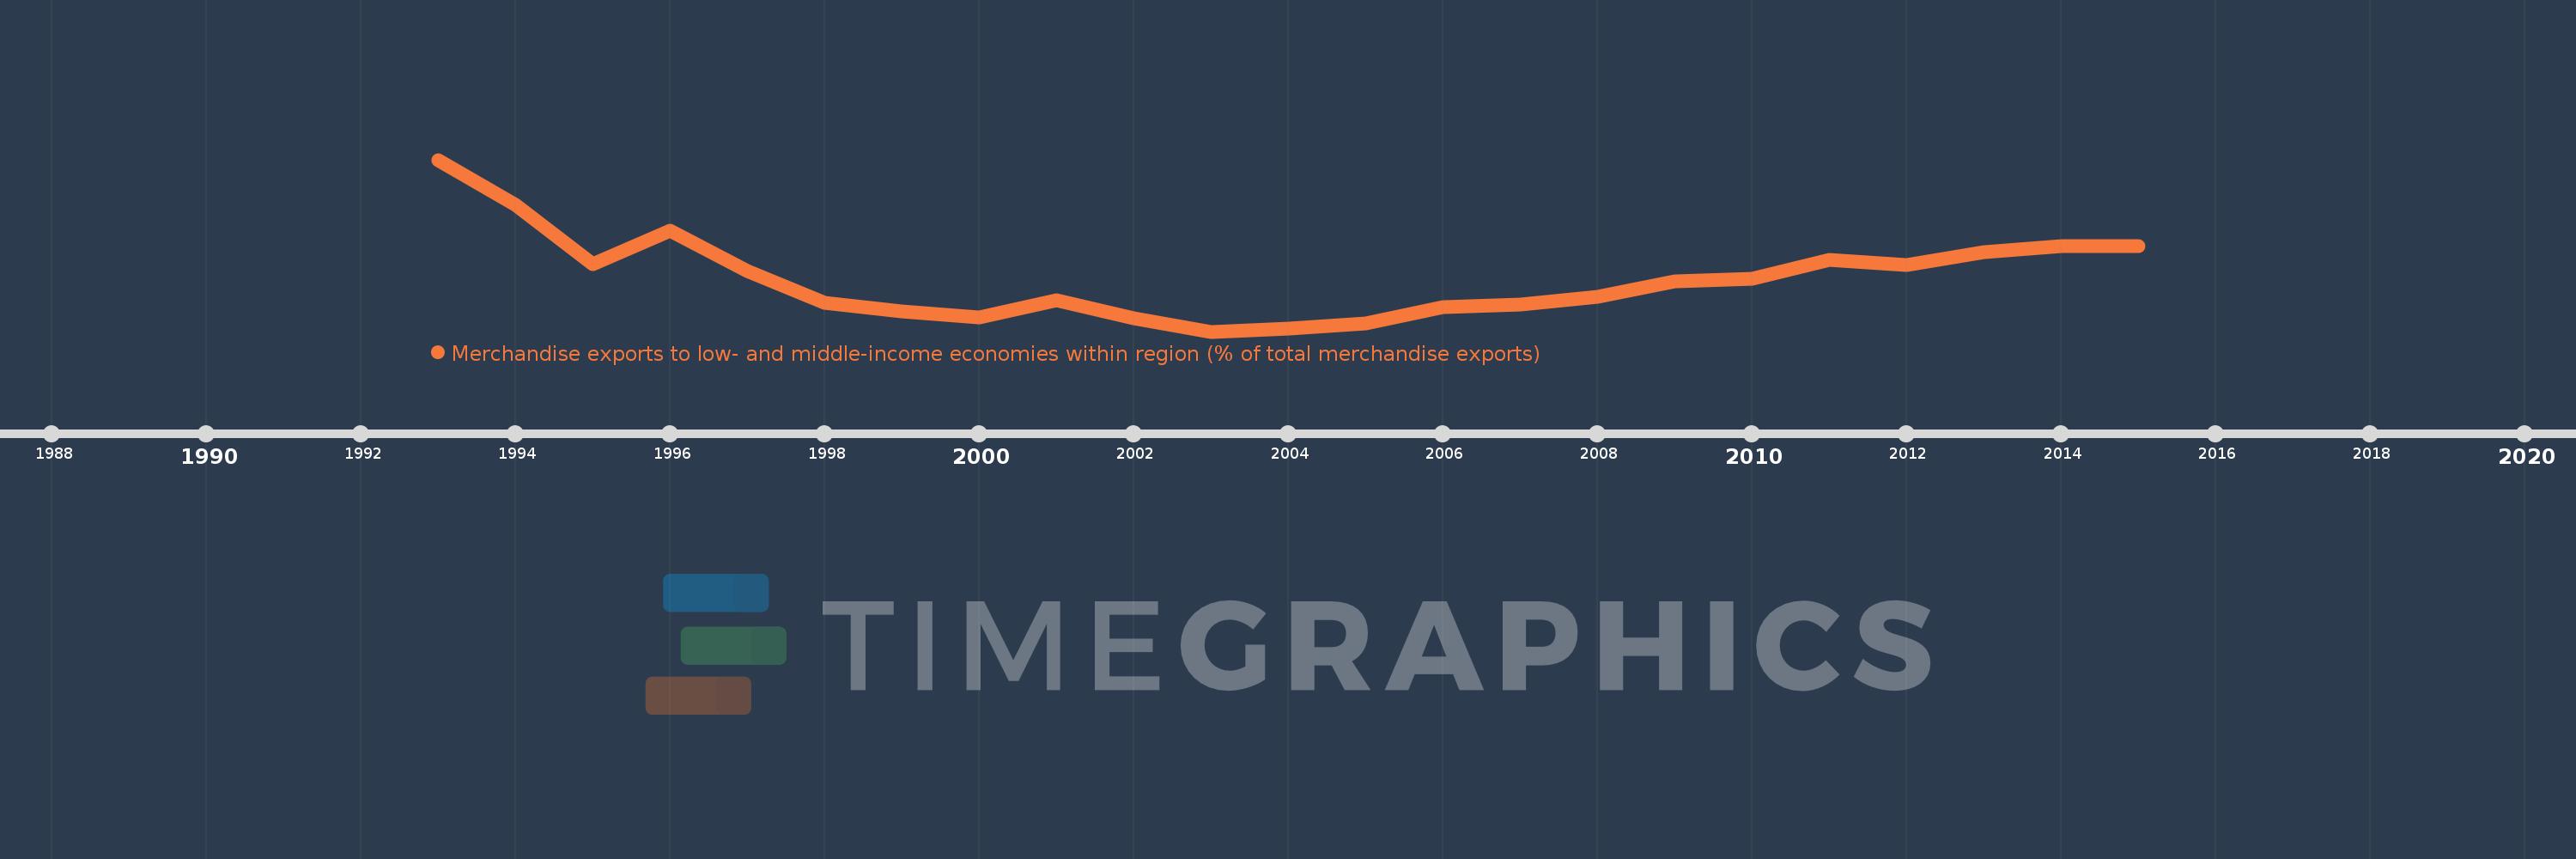
Merchandise exports to low- and middle-income economies within region (% of total merchandise exports)
2015,2014,2013,2012,2011,2010,2009,2008,2007,2006,2005,2004,2003,2002,2001,2000,1999,1998,1997,1996,1995,1994,1993
This statistics in other country:
Timeline:
This timeline shows a graph from 1993 to 2015 of Belarus. No data until 1992. Number of actual observations by date: 23.
Source name:
World Development Indicators
Source organization:
World Bank staff estimates based data from International Monetary Fund's Direction of Trade database.
Categories, topics:
Private Sector, Trade
Last updated:
apr 23, 2017
Indicators value changes by year
Maximum:
29.528
jan 1, 1993
At the date of observation
Value
Absolute change
Change from previous value
jan 1, 1993
29.528
+29.528
0.0%
jan 1, 1994
23.309
-6.219
-21.06%
jan 1, 1995
15.179
-8.13
-34.88%
jan 1, 1996
19.785
+4.606
30.35%
jan 1, 1997
14.343
-5.441
-27.5%
jan 1, 1998
9.884
-4.46
-31.09%
jan 1, 1999
8.718
-1.166
-11.8%
jan 1, 2000
7.905
-0.813
-9.32%
jan 1, 2001
10.295
+2.39
30.23%
jan 1, 2002
7.818
-2.477
-24.06%
jan 1, 2003
5.993
-1.824
-23.33%
jan 1, 2004
6.416
+0.423
7.05%
jan 1, 2005
7.079
+0.663
10.33%
jan 1, 2006
9.29
+2.211
31.23%
jan 1, 2007
9.69
+0.4
4.3%
jan 1, 2008
10.719
+1.029
10.62%
jan 1, 2009
12.911
+2.192
20.45%
jan 1, 2010
13.25
+0.34
2.63%
jan 1, 2011
15.87
+2.619
19.77%
jan 1, 2012
15.154
-0.715
-4.51%
jan 1, 2013
16.915
+1.76
11.62%
jan 1, 2014
17.756
+0.842
4.98%
jan 1, 2015
17.754
-0.003
-0.01%
Ranking of countries by current statistics by years


Comments: