29
/
en
AIzaSyAYiBZKx7MnpbEhh9jyipgxe19OcubqV5w
April 1, 2024
158658
Iraq
IRQ
true
2
1
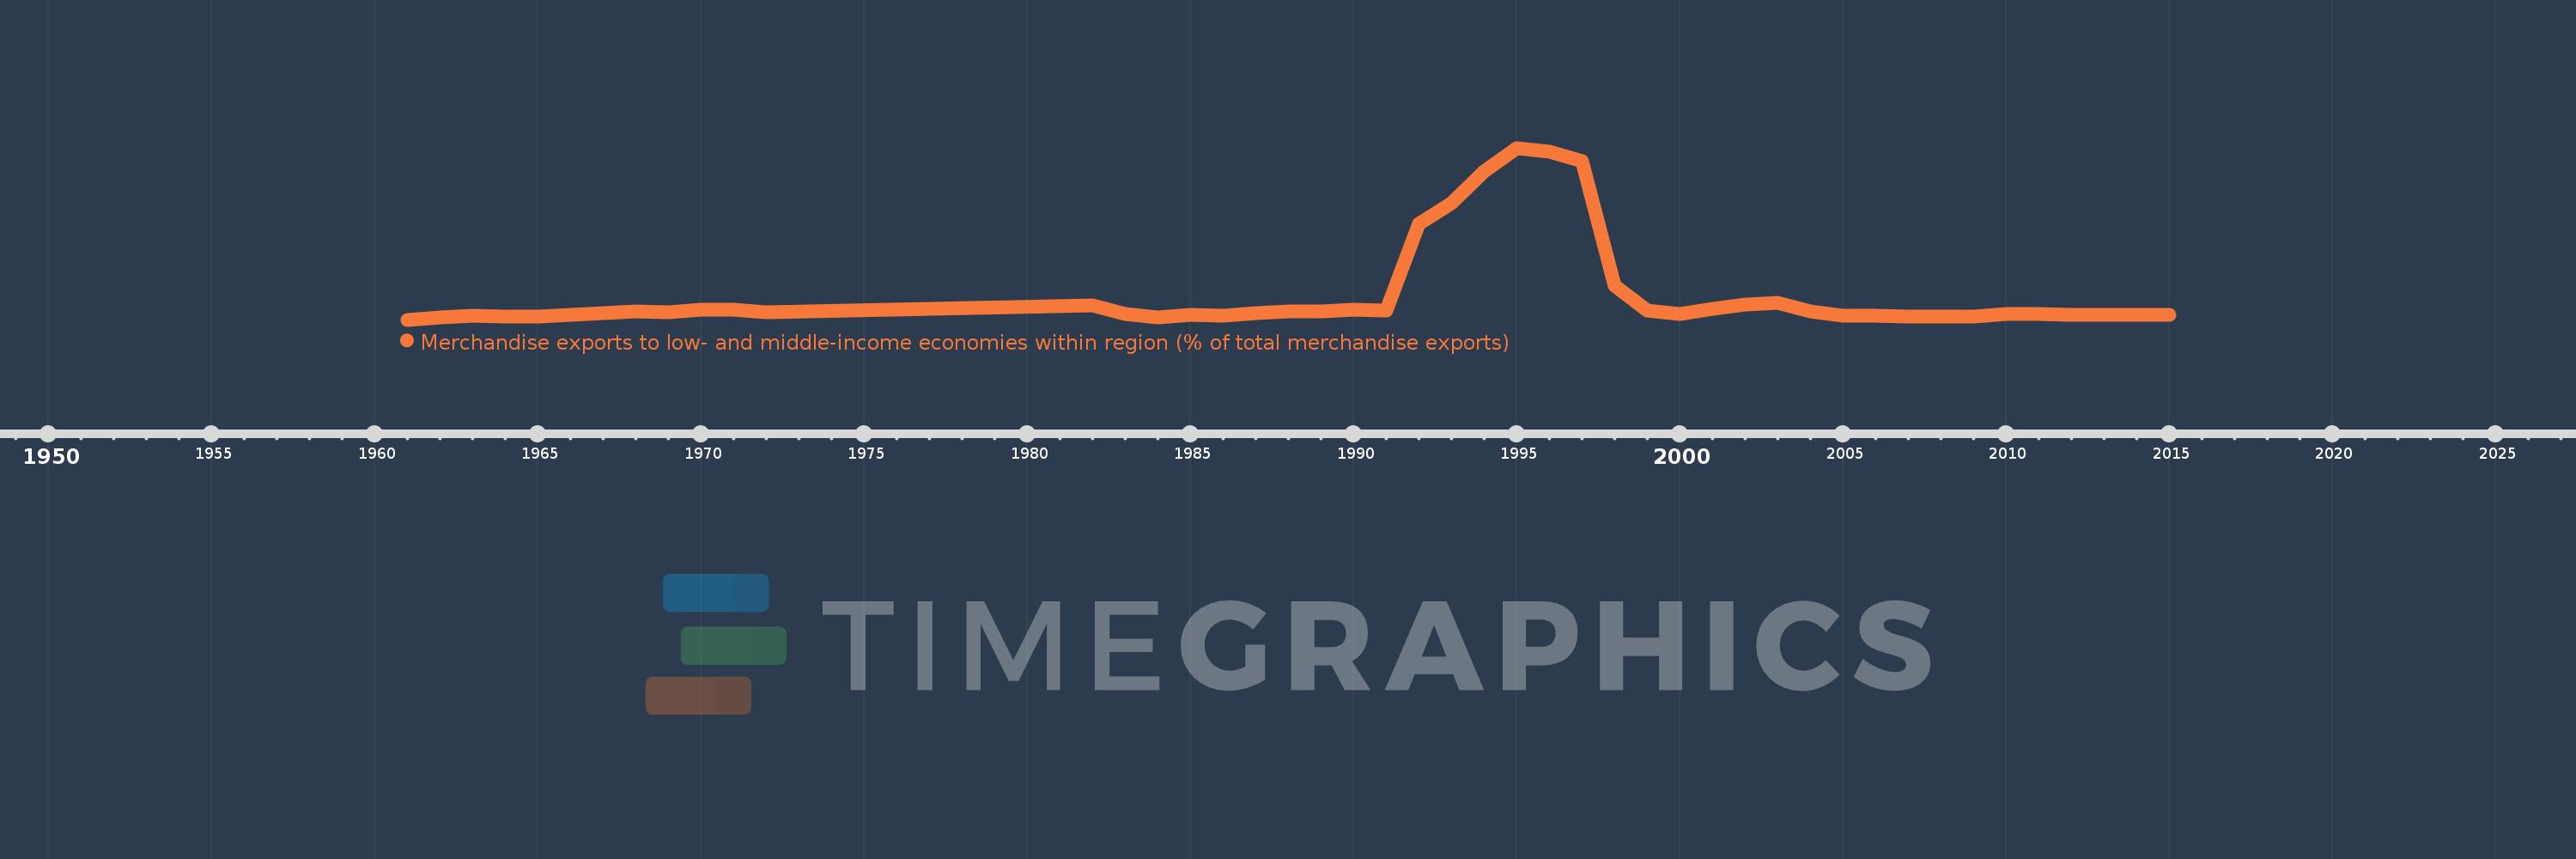
Merchandise exports to low- and middle-income economies within region (% of total merchandise exports)
2015,2014,2013,2012,2011,2010,2009,2008,2007,2006,2005,2004,2003,2002,2001,2000,1999,1998,1997,1996,1995,1994,1993,1992,1991,1990,1989,1988,1987,1986,1985,1984,1983,1982,1972,1971,1970,1969,1968,1967,1966,1965,1964,1963,1962,1961
This statistics in other country:
Timeline:
This timeline shows a graph from 1961 to 2015 of Iraq. No data until 1960. Number of actual observations by date: 46.
Source name:
World Development Indicators
Source organization:
World Bank staff estimates based data from International Monetary Fund's Direction of Trade database.
Categories, topics:
Private Sector, Trade
Last updated:
apr 23, 2017
Indicators value changes by year
Maximum:
98.876
jan 1, 1995
At the date of observation
Value
Absolute change
Change from previous value
jan 1, 1961
0.79
+0.79
0.0%
jan 1, 1962
2.015
+1.225
154.98%
jan 1, 1963
2.985
+0.97
48.15%
jan 1, 1964
2.618
-0.367
-12.29%
jan 1, 1965
2.67
+0.052
1.99%
jan 1, 1966
3.526
+0.856
32.05%
jan 1, 1967
4.408
+0.881
24.99%
jan 1, 1968
5.765
+1.357
30.8%
jan 1, 1969
5.204
-0.561
-9.74%
jan 1, 1970
6.346
+1.142
21.95%
jan 1, 1971
6.506
+0.16
2.52%
jan 1, 1972
4.921
-1.584
-24.35%
jan 1, 1982
9.139
+4.218
85.71%
jan 1, 1983
4.279
-4.86
-53.18%
jan 1, 1984
1.927
-2.352
-54.96%
jan 1, 1985
3.387
+1.46
75.73%
jan 1, 1986
3.16
-0.227
-6.7%
jan 1, 1987
4.63
+1.47
46.52%
jan 1, 1988
5.389
+0.759
16.4%
jan 1, 1989
5.493
+0.103
1.92%
jan 1, 1990
6.323
+0.83
15.11%
jan 1, 1991
5.927
-0.396
-6.26%
jan 1, 1992
55.612
+49.686
838.32%
jan 1, 1993
67.143
+11.53
20.73%
jan 1, 1994
85.466
+18.323
27.29%
jan 1, 1995
98.876
+13.41
15.69%
jan 1, 1996
96.726
-2.15
-2.17%
jan 1, 1997
91.456
-5.27
-5.45%
jan 1, 1998
20.226
-71.229
-77.88%
jan 1, 1999
5.933
-14.293
-70.66%
jan 1, 2000
4.08
-1.854
-31.24%
jan 1, 2001
7.257
+3.177
77.87%
jan 1, 2002
9.452
+2.195
30.25%
jan 1, 2003
10.441
+0.989
10.47%
jan 1, 2004
5.401
-5.04
-48.27%
jan 1, 2005
3.291
-2.11
-39.07%
jan 1, 2006
3.333
+0.042
1.29%
jan 1, 2007
2.453
-0.881
-26.42%
jan 1, 2008
2.415
-0.037
-1.52%
jan 1, 2009
2.815
+0.4
16.55%
jan 1, 2010
4.101
+1.286
45.67%
jan 1, 2011
3.881
-0.22
-5.36%
jan 1, 2012
3.551
-0.33
-8.51%
jan 1, 2013
3.746
+0.195
5.49%
jan 1, 2014
3.797
+0.052
1.38%
jan 1, 2015
3.469
-0.328
-8.63%
Ranking of countries by current statistics by years


Comments: