29
/
en
AIzaSyAYiBZKx7MnpbEhh9jyipgxe19OcubqV5w
April 1, 2024
116015
Cuba
CUB
true
2
1
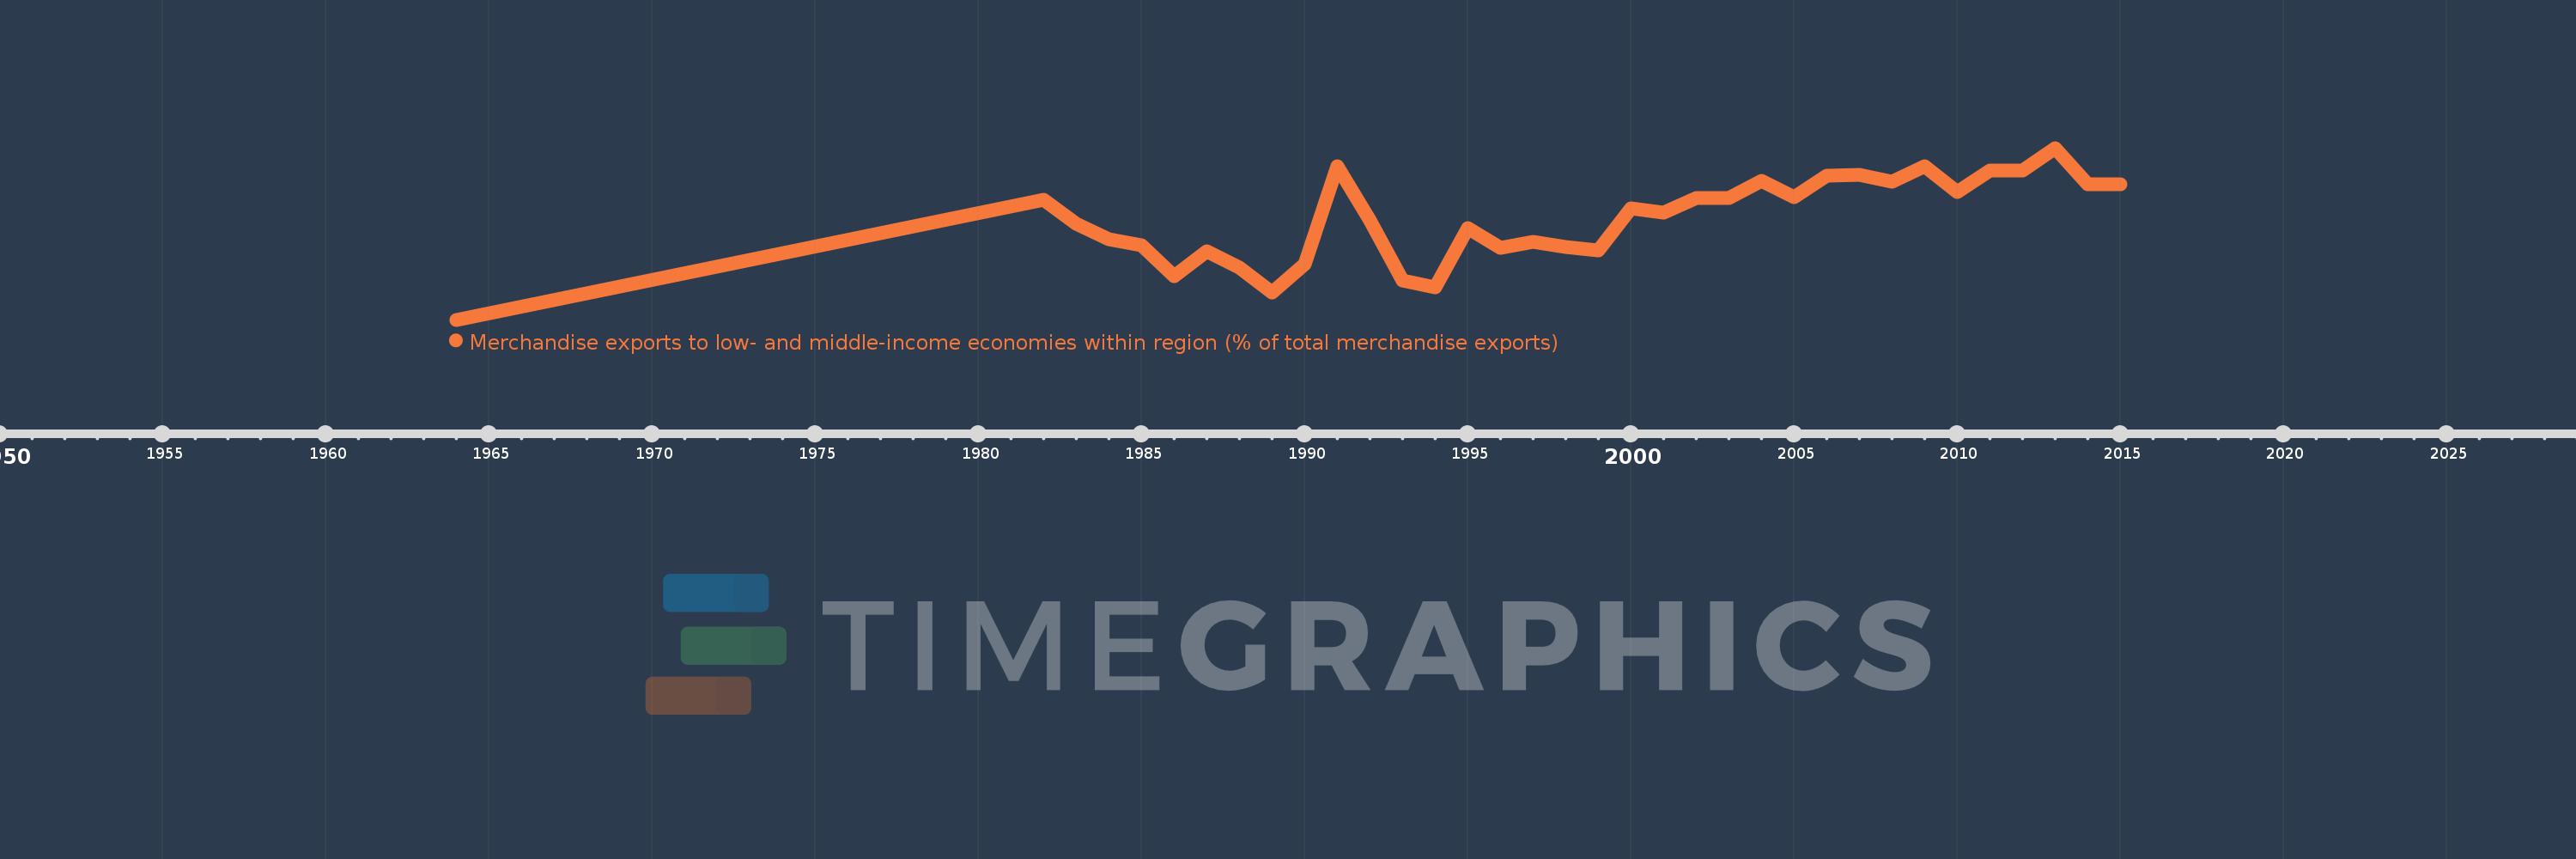
Merchandise exports to low- and middle-income economies within region (% of total merchandise exports)
2015,2014,2013,2012,2011,2010,2009,2008,2007,2006,2005,2004,2003,2002,2001,2000,1999,1998,1997,1996,1995,1994,1993,1992,1991,1990,1989,1988,1987,1986,1985,1984,1983,1982,1964
This statistics in other country:
Timeline:
This timeline shows a graph from 1964 to 2015 of Cuba. No data until 1963. Number of actual observations by date: 35.
Source name:
World Development Indicators
Source organization:
World Bank staff estimates based data from International Monetary Fund's Direction of Trade database.
Categories, topics:
Private Sector, Trade
Last updated:
apr 23, 2017
Indicators value changes by year
Maximum:
13.112
jan 1, 2013
At the date of observation
Value
Absolute change
Change from previous value
jan 1, 1982
9.154
+9.154
%
jan 1, 1983
7.34
-1.813
-19.81%
jan 1, 1984
6.145
-1.195
-16.29%
jan 1, 1985
5.711
-0.434
-7.07%
jan 1, 1986
3.356
-2.354
-41.23%
jan 1, 1987
5.197
+1.841
54.84%
jan 1, 1988
3.98
-1.217
-23.42%
jan 1, 1989
2.103
-1.876
-47.15%
jan 1, 1990
4.271
+2.168
103.07%
jan 1, 1991
11.722
+7.451
174.44%
jan 1, 1992
7.595
-4.127
-35.21%
jan 1, 1993
3.011
-4.583
-60.35%
jan 1, 1994
2.44
-0.572
-18.98%
jan 1, 1995
7.028
+4.588
188.06%
jan 1, 1996
5.497
-1.531
-21.78%
jan 1, 1997
5.93
+0.433
7.87%
jan 1, 1998
5.549
-0.381
-6.42%
jan 1, 1999
5.269
-0.28
-5.04%
jan 1, 2000
8.483
+3.214
61.0%
jan 1, 2001
8.175
-0.308
-3.63%
jan 1, 2002
9.312
+1.137
13.91%
jan 1, 2003
9.264
-0.048
-0.52%
jan 1, 2004
10.589
+1.325
14.3%
jan 1, 2005
9.353
-1.236
-11.67%
jan 1, 2006
11.027
+1.674
17.9%
jan 1, 2007
11.071
+0.045
0.4%
jan 1, 2008
10.505
-0.567
-5.12%
jan 1, 2009
11.692
+1.187
11.3%
jan 1, 2010
9.726
-1.966
-16.82%
jan 1, 2011
11.384
+1.658
17.05%
jan 1, 2012
11.357
-0.027
-0.24%
jan 1, 2013
13.112
+1.755
15.46%
jan 1, 2014
10.347
-2.765
-21.09%
jan 1, 2015
10.361
+0.015
0.14%
Ranking of countries by current statistics by years


Comments: