29
/
en
AIzaSyAYiBZKx7MnpbEhh9jyipgxe19OcubqV5w
April 1, 2024
122420
Dominican Republic
DOM
true
2
1
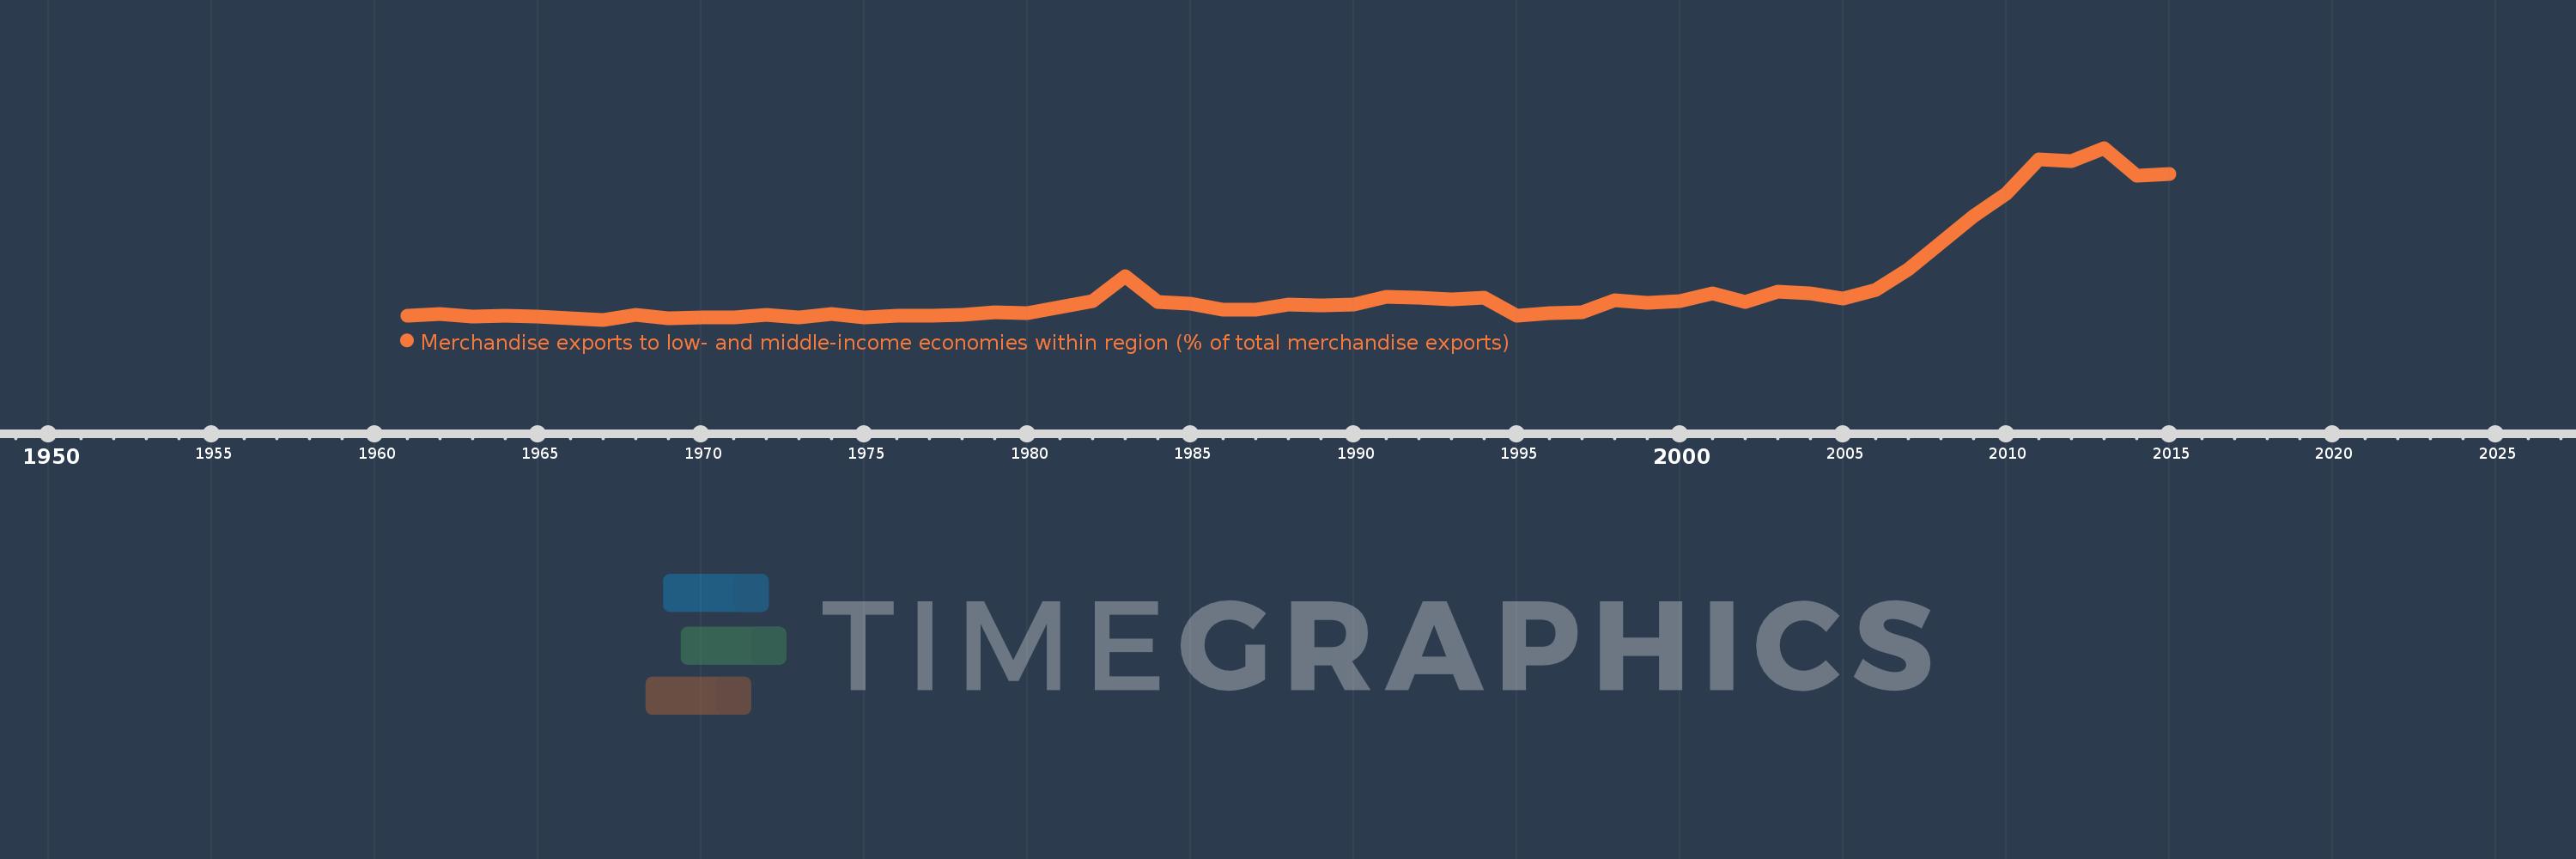
Merchandise exports to low- and middle-income economies within region (% of total merchandise exports)
2015,2014,2013,2012,2011,2010,2009,2008,2007,2006,2005,2004,2003,2002,2001,2000,1999,1998,1997,1996,1995,1994,1993,1992,1991,1990,1989,1988,1987,1986,1985,1984,1983,1982,1981,1980,1979,1978,1977,1976,1975,1974,1973,1972,1971,1970,1969,1968,1967,1966,1965,1964,1963,1962,1961
This statistics in other country:
Timeline:
This timeline shows a graph from 1961 to 2015 of Dominican Republic. No data until 1960. Number of actual observations by date: 55.
Source name:
World Development Indicators
Source organization:
World Bank staff estimates based data from International Monetary Fund's Direction of Trade database.
Categories, topics:
Private Sector, Trade
Last updated:
apr 23, 2017
Indicators value changes by year
Maximum:
24.347
jan 1, 2013
At the date of observation
Value
Absolute change
Change from previous value
jan 1, 1961
0.555
+0.555
0.0%
jan 1, 1962
0.776
+0.221
39.79%
jan 1, 1963
0.463
-0.313
-40.33%
jan 1, 1964
0.538
+0.075
16.25%
jan 1, 1965
0.466
-0.072
-13.46%
jan 1, 1966
0.266
-0.2
-42.95%
jan 1, 1967
0.0
-0.266
-100.0%
jan 1, 1968
0.663
+0.663
%
jan 1, 1969
0.243
-0.42
-63.41%
jan 1, 1970
0.312
+0.07
28.72%
jan 1, 1971
0.356
+0.044
14.0%
jan 1, 1972
0.658
+0.303
85.01%
jan 1, 1973
0.36
-0.299
-45.35%
jan 1, 1974
0.855
+0.495
137.64%
jan 1, 1975
0.297
-0.558
-65.23%
jan 1, 1976
0.62
+0.323
108.5%
jan 1, 1977
0.563
-0.057
-9.21%
jan 1, 1978
0.634
+0.071
12.6%
jan 1, 1979
1.037
+0.403
63.59%
jan 1, 1980
0.884
-0.153
-14.75%
jan 1, 1981
1.791
+0.907
102.68%
jan 1, 1982
2.628
+0.837
46.75%
jan 1, 1983
6.159
+3.531
134.37%
jan 1, 1984
2.543
-3.616
-58.7%
jan 1, 1985
2.261
-0.283
-11.11%
jan 1, 1986
1.482
-0.779
-34.45%
jan 1, 1987
1.444
-0.037
-2.53%
jan 1, 1988
2.138
+0.694
48.03%
jan 1, 1989
2.083
-0.055
-2.58%
jan 1, 1990
2.207
+0.124
5.95%
jan 1, 1991
3.242
+1.035
46.9%
jan 1, 1992
3.148
-0.094
-2.91%
jan 1, 1993
2.87
-0.278
-8.84%
jan 1, 1994
3.094
+0.224
7.81%
jan 1, 1995
0.61
-2.483
-80.27%
jan 1, 1996
0.968
+0.357
58.55%
jan 1, 1997
1.02
+0.052
5.39%
jan 1, 1998
2.704
+1.684
165.13%
jan 1, 1999
2.451
-0.253
-9.34%
jan 1, 2000
2.66
+0.209
8.53%
jan 1, 2001
3.699
+1.039
39.06%
jan 1, 2002
2.574
-1.125
-30.42%
jan 1, 2003
3.943
+1.369
53.17%
jan 1, 2004
3.7
-0.243
-6.16%
jan 1, 2005
3.002
-0.699
-18.88%
jan 1, 2006
4.183
+1.182
39.37%
jan 1, 2007
7.17
+2.987
71.4%
jan 1, 2008
10.873
+3.703
51.65%
jan 1, 2009
14.675
+3.802
34.96%
jan 1, 2010
17.888
+3.213
21.89%
jan 1, 2011
22.701
+4.813
26.9%
jan 1, 2012
22.462
-0.239
-1.05%
jan 1, 2013
24.347
+1.885
8.39%
jan 1, 2014
20.356
-3.991
-16.39%
jan 1, 2015
20.663
+0.307
1.51%
Ranking of countries by current statistics by years


Comments: