29
/
en
AIzaSyAYiBZKx7MnpbEhh9jyipgxe19OcubqV5w
April 1, 2024
179121
Liberia
LBR
true
2
1
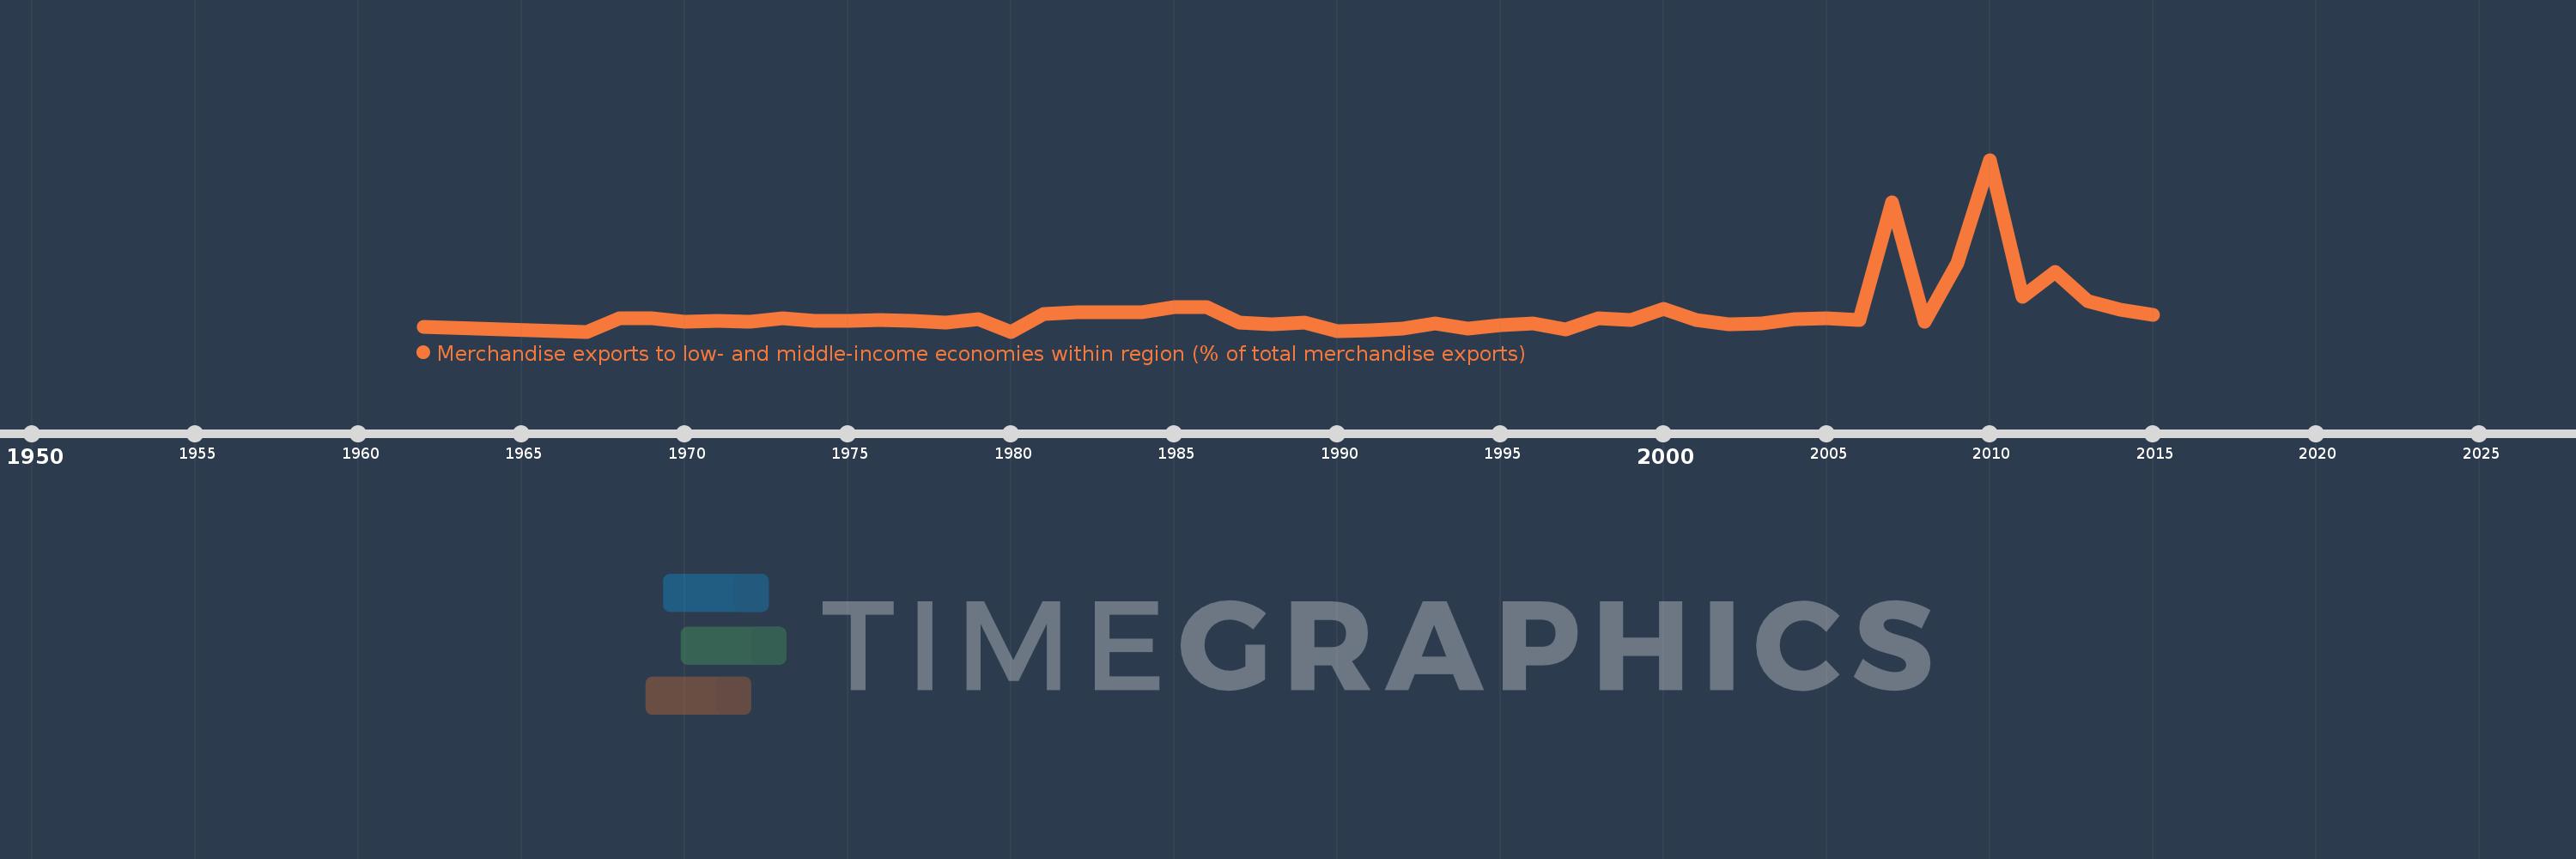
Merchandise exports to low- and middle-income economies within region (% of total merchandise exports)
2015,2014,2013,2012,2011,2010,2009,2008,2007,2006,2005,2004,2003,2002,2001,2000,1999,1998,1997,1996,1995,1994,1993,1992,1991,1990,1989,1988,1987,1986,1985,1984,1983,1982,1981,1980,1979,1978,1977,1976,1975,1974,1973,1972,1971,1970,1969,1968,1967,1962
This statistics in other country:
Timeline:
This timeline shows a graph from 1962 to 2015 of Liberia. No data until 1961. Number of actual observations by date: 50.
Source name:
World Development Indicators
Source organization:
World Bank staff estimates based data from International Monetary Fund's Direction of Trade database.
Categories, topics:
Private Sector, Trade
Last updated:
apr 23, 2017
Indicators value changes by year
Maximum:
18.174
jan 1, 2010
At the date of observation
Value
Absolute change
Change from previous value
jan 1, 1962
0.485
+0.485
0.0%
jan 1, 1967
0.0
-0.485
-100.0%
jan 1, 1968
1.407
+1.407
%
jan 1, 1969
1.366
-0.041
-2.92%
jan 1, 1970
1.061
-0.305
-22.32%
jan 1, 1971
1.154
+0.093
8.8%
jan 1, 1972
1.042
-0.112
-9.74%
jan 1, 1973
1.408
+0.366
35.1%
jan 1, 1974
1.097
-0.31
-22.04%
jan 1, 1975
1.143
+0.046
4.2%
jan 1, 1976
1.226
+0.082
7.21%
jan 1, 1977
1.155
-0.071
-5.79%
jan 1, 1978
0.92
-0.235
-20.37%
jan 1, 1979
1.355
+0.435
47.32%
jan 1, 1980
0.0
-1.355
-100.0%
jan 1, 1981
1.865
+1.865
%
jan 1, 1982
2.016
+0.151
8.09%
jan 1, 1983
2.025
+0.009
0.46%
jan 1, 1984
2.033
+0.008
0.39%
jan 1, 1985
2.603
+0.57
28.04%
jan 1, 1986
2.603
0.0
0.0%
jan 1, 1987
0.924
-1.68
-64.52%
jan 1, 1988
0.747
-0.177
-19.13%
jan 1, 1989
0.953
+0.206
27.6%
jan 1, 1990
0.081
-0.872
-91.45%
jan 1, 1991
0.177
+0.095
116.98%
jan 1, 1992
0.343
+0.166
94.17%
jan 1, 1993
0.819
+0.476
138.69%
jan 1, 1994
0.295
-0.525
-64.04%
jan 1, 1995
0.696
+0.402
136.32%
jan 1, 1996
0.899
+0.203
29.18%
jan 1, 1997
0.199
-0.701
-77.89%
jan 1, 1998
1.408
+1.209
607.66%
jan 1, 1999
1.192
-0.216
-15.35%
jan 1, 2000
2.416
+1.224
102.72%
jan 1, 2001
1.202
-1.214
-50.24%
jan 1, 2002
0.777
-0.425
-35.37%
jan 1, 2003
0.852
+0.075
9.72%
jan 1, 2004
1.277
+0.425
49.88%
jan 1, 2005
1.432
+0.154
12.09%
jan 1, 2006
1.268
-0.164
-11.46%
jan 1, 2007
13.637
+12.369
975.72%
jan 1, 2008
1.071
-12.566
-92.15%
jan 1, 2009
7.269
+6.198
578.79%
jan 1, 2010
18.174
+10.905
150.02%
jan 1, 2011
3.703
-14.471
-79.62%
jan 1, 2012
6.32
+2.617
70.67%
jan 1, 2013
3.195
-3.125
-49.44%
jan 1, 2014
2.287
-0.909
-28.43%
jan 1, 2015
1.804
-0.482
-21.09%
Ranking of countries by current statistics by years


Comments: