29
/
en
AIzaSyAYiBZKx7MnpbEhh9jyipgxe19OcubqV5w
April 1, 2024
29278
East Asia & Pacific (IDA & IBRD countries)
TEA
false
2
1
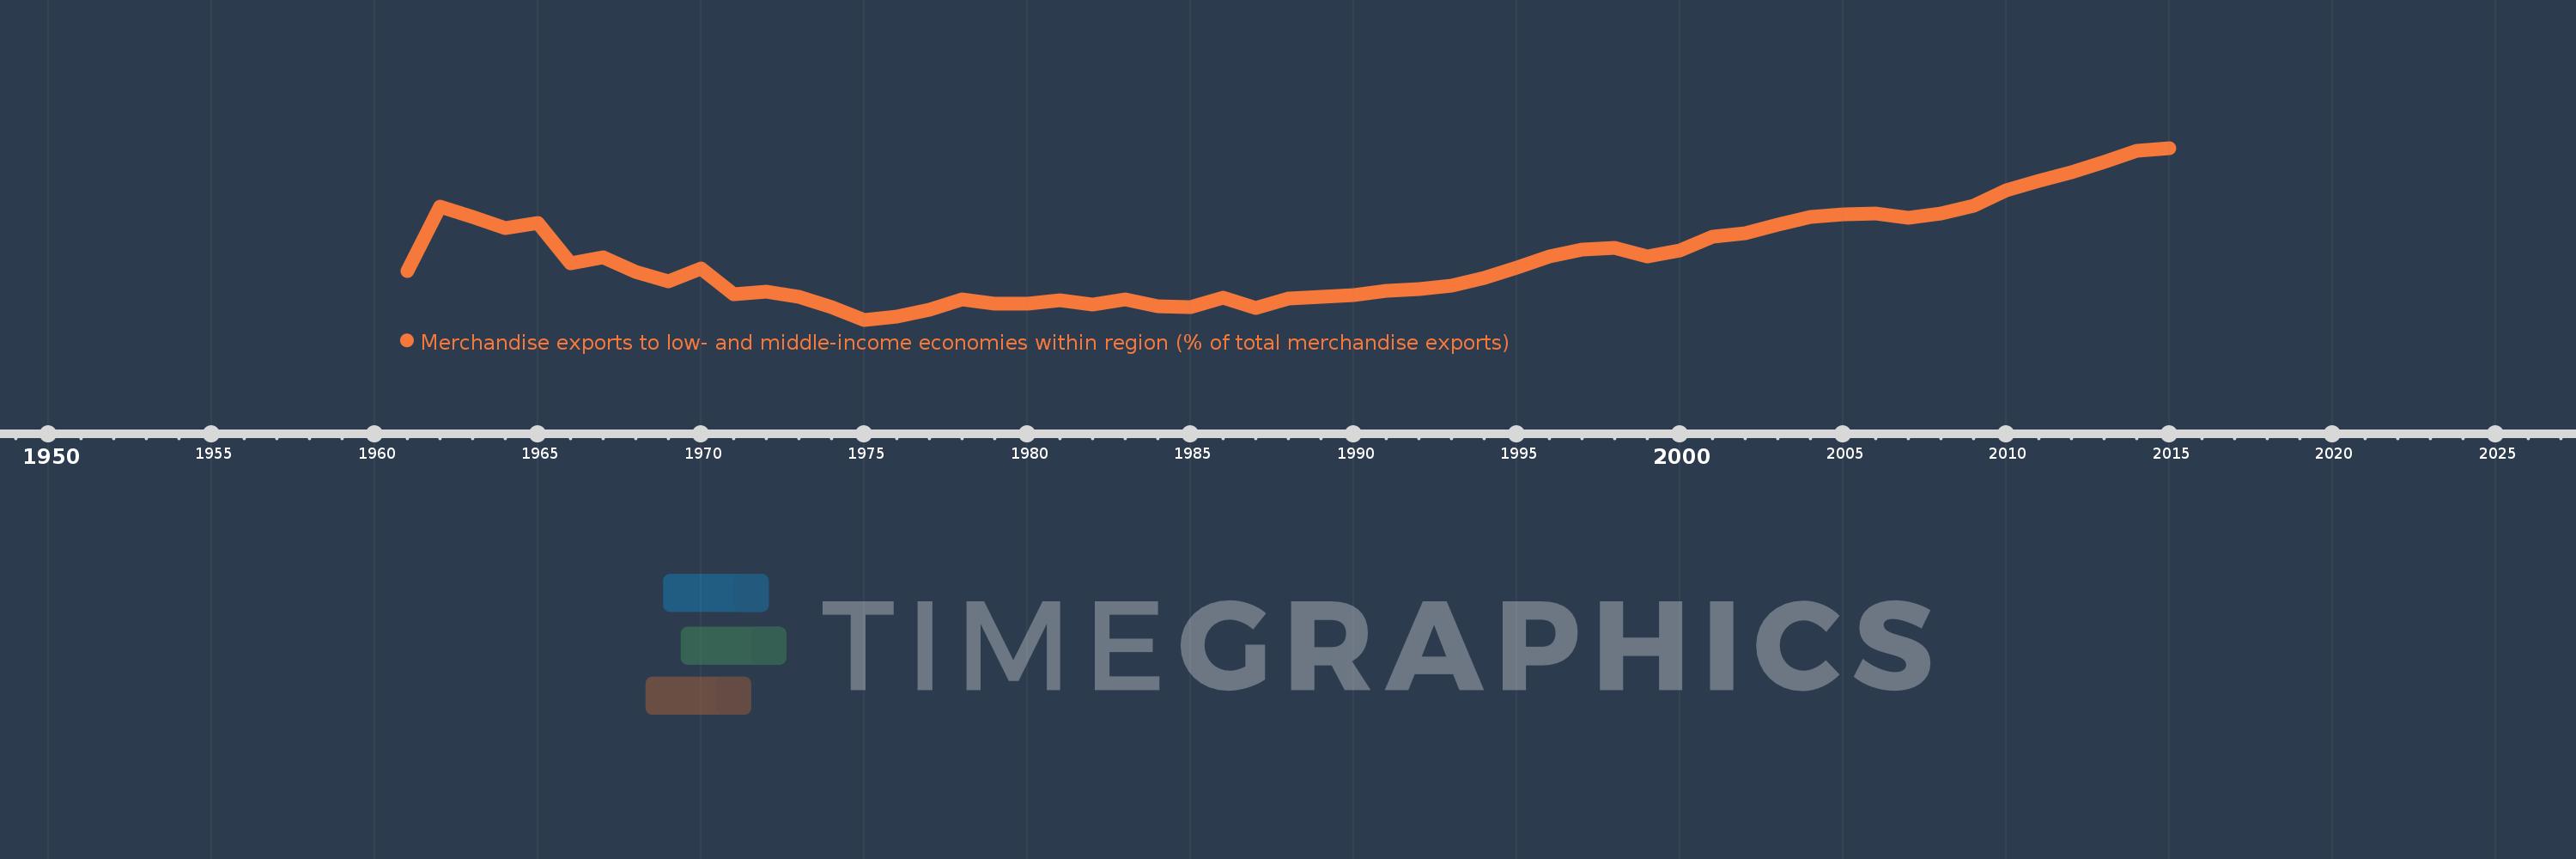
Merchandise exports to low- and middle-income economies within region (% of total merchandise exports)
2015,2014,2013,2012,2011,2010,2009,2008,2007,2006,2005,2004,2003,2002,2001,2000,1999,1998,1997,1996,1995,1994,1993,1992,1991,1990,1989,1988,1987,1986,1985,1984,1983,1982,1981,1980,1979,1978,1977,1976,1975,1974,1973,1972,1971,1970,1969,1968,1967,1966,1965,1964,1963,1962,1961
This statistics in other country:
Timeline:
This timeline shows a graph from 1961 to 2015 of East Asia & Pacific (IDA & IBRD countries). No data until 1960. Number of actual observations by date: 55.
Source name:
World Development Indicators
Source organization:
World Bank staff estimates based data from International Monetary Fund's Direction of Trade database.
Categories, topics:
Private Sector, Trade
Last updated:
apr 23, 2017
Indicators value changes by year
Maximum:
14.466
jan 1, 2015
At the date of observation
Value
Absolute change
Change from previous value
jan 1, 1961
6.822
+6.822
0.0%
jan 1, 1962
10.804
+3.982
58.38%
jan 1, 1963
10.174
-0.63
-5.83%
jan 1, 1964
9.493
-0.681
-6.7%
jan 1, 1965
9.804
+0.311
3.28%
jan 1, 1966
7.281
-2.523
-25.73%
jan 1, 1967
7.685
+0.404
5.55%
jan 1, 1968
6.786
-0.899
-11.7%
jan 1, 1969
6.195
-0.591
-8.71%
jan 1, 1970
7.007
+0.812
13.11%
jan 1, 1971
5.392
-1.615
-23.04%
jan 1, 1972
5.56
+0.168
3.11%
jan 1, 1973
5.235
-0.325
-5.84%
jan 1, 1974
4.575
-0.66
-12.6%
jan 1, 1975
3.802
-0.773
-16.9%
jan 1, 1976
3.997
+0.195
5.12%
jan 1, 1977
4.409
+0.413
10.33%
jan 1, 1978
5.086
+0.677
15.34%
jan 1, 1979
4.791
-0.295
-5.81%
jan 1, 1980
4.809
+0.019
0.39%
jan 1, 1981
5.025
+0.216
4.49%
jan 1, 1982
4.721
-0.304
-6.05%
jan 1, 1983
5.048
+0.326
6.92%
jan 1, 1984
4.643
-0.405
-8.02%
jan 1, 1985
4.585
-0.057
-1.24%
jan 1, 1986
5.158
+0.573
12.49%
jan 1, 1987
4.52
-0.638
-12.37%
jan 1, 1988
5.103
+0.583
12.9%
jan 1, 1989
5.222
+0.118
2.32%
jan 1, 1990
5.357
+0.135
2.58%
jan 1, 1991
5.578
+0.222
4.14%
jan 1, 1992
5.715
+0.137
2.45%
jan 1, 1993
5.922
+0.207
3.62%
jan 1, 1994
6.388
+0.466
7.87%
jan 1, 1995
7.043
+0.655
10.26%
jan 1, 1996
7.758
+0.715
10.16%
jan 1, 1997
8.132
+0.374
4.82%
jan 1, 1998
8.267
+0.134
1.65%
jan 1, 1999
7.721
-0.546
-6.6%
jan 1, 2000
8.11
+0.389
5.04%
jan 1, 2001
8.936
+0.826
10.19%
jan 1, 2002
9.164
+0.228
2.55%
jan 1, 2003
9.705
+0.541
5.9%
jan 1, 2004
10.204
+0.499
5.14%
jan 1, 2005
10.351
+0.148
1.45%
jan 1, 2006
10.378
+0.027
0.26%
jan 1, 2007
10.124
-0.254
-2.45%
jan 1, 2008
10.411
+0.287
2.84%
jan 1, 2009
10.876
+0.465
4.46%
jan 1, 2010
11.853
+0.977
8.99%
jan 1, 2011
12.408
+0.555
4.68%
jan 1, 2012
12.982
+0.574
4.63%
jan 1, 2013
13.59
+0.608
4.68%
jan 1, 2014
14.28
+0.691
5.08%
jan 1, 2015
14.466
+0.185
1.3%
Ranking of countries by current statistics by years


Comments: