29
/
en
AIzaSyAYiBZKx7MnpbEhh9jyipgxe19OcubqV5w
April 1, 2024
60001
Sub-Saharan Africa (excluding high income)
SSA
false
2
1
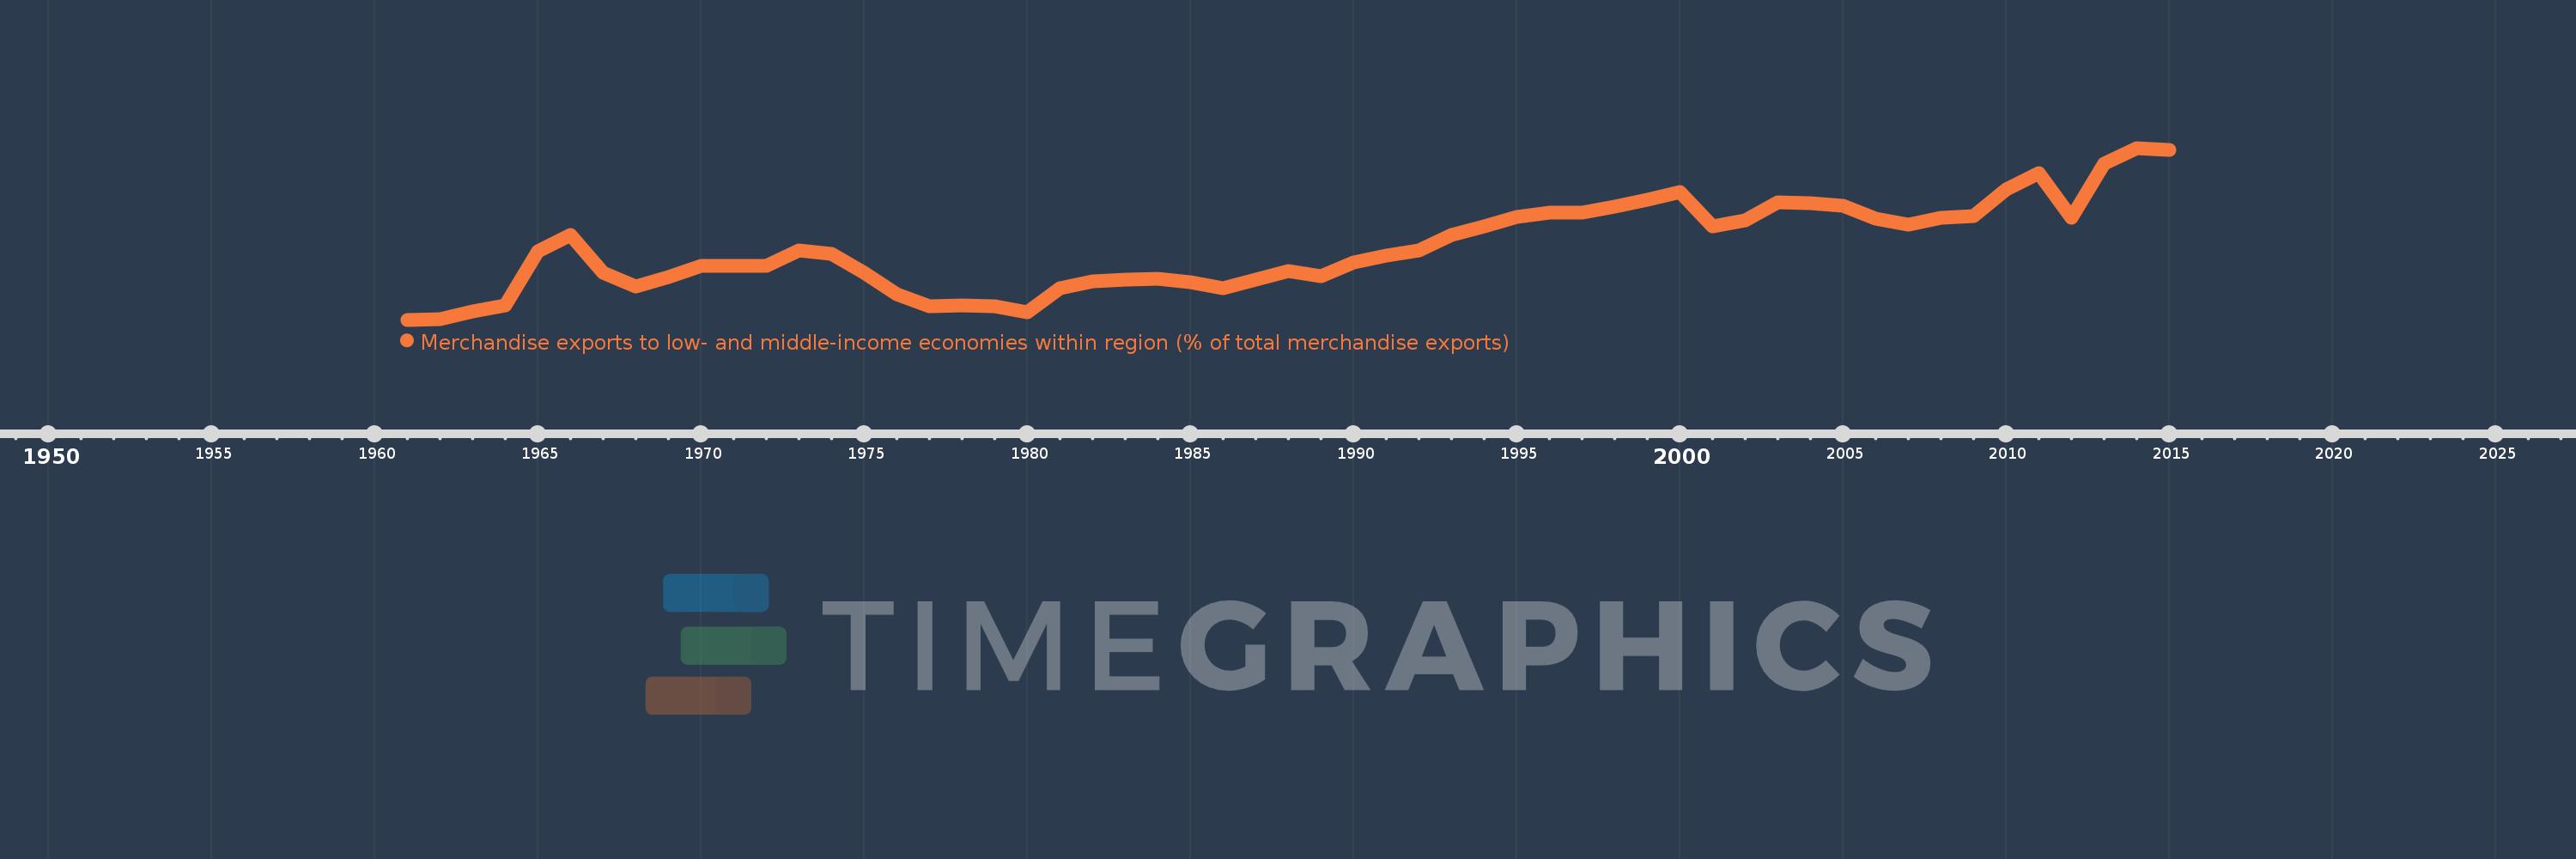
Merchandise exports to low- and middle-income economies within region (% of total merchandise exports)
2015,2014,2013,2012,2011,2010,2009,2008,2007,2006,2005,2004,2003,2002,2001,2000,1999,1998,1997,1996,1995,1994,1993,1992,1991,1990,1989,1988,1987,1986,1985,1984,1983,1982,1981,1980,1979,1978,1977,1976,1975,1974,1973,1972,1971,1970,1969,1968,1967,1966,1965,1964,1963,1962,1961
This statistics in other country:
Timeline:
This timeline shows a graph from 1961 to 2015 of Sub-Saharan Africa (excluding high income). No data until 1960. Number of actual observations by date: 55.
Source name:
World Development Indicators
Source organization:
World Bank staff estimates based data from International Monetary Fund's Direction of Trade database.
Categories, topics:
Private Sector, Trade
Last updated:
apr 23, 2017
Indicators value changes by year
At the date of observation
Value
Absolute change
Change from previous value
jan 1, 1961
3.007
+3.007
0.0%
jan 1, 1962
3.051
+0.044
1.46%
jan 1, 1963
3.635
+0.584
19.13%
jan 1, 1964
4.107
+0.472
12.99%
jan 1, 1965
8.435
+4.329
105.4%
jan 1, 1966
9.739
+1.304
15.46%
jan 1, 1967
6.714
-3.026
-31.07%
jan 1, 1968
5.613
-1.101
-16.4%
jan 1, 1969
6.393
+0.781
13.91%
jan 1, 1970
7.276
+0.883
13.81%
jan 1, 1971
7.246
-0.03
-0.42%
jan 1, 1972
7.277
+0.031
0.43%
jan 1, 1973
8.45
+1.174
16.13%
jan 1, 1974
8.237
-0.214
-2.53%
jan 1, 1975
6.748
-1.488
-18.07%
jan 1, 1976
5.015
-1.734
-25.69%
jan 1, 1977
4.043
-0.972
-19.37%
jan 1, 1978
4.136
+0.092
2.29%
jan 1, 1979
4.1
-0.035
-0.86%
jan 1, 1980
3.625
-0.475
-11.58%
jan 1, 1981
5.507
+1.882
51.9%
jan 1, 1982
6.028
+0.521
9.47%
jan 1, 1983
6.162
+0.134
2.22%
jan 1, 1984
6.26
+0.098
1.59%
jan 1, 1985
5.944
-0.315
-5.04%
jan 1, 1986
5.472
-0.472
-7.94%
jan 1, 1987
6.208
+0.736
13.45%
jan 1, 1988
6.87
+0.662
10.66%
jan 1, 1989
6.481
-0.389
-5.66%
jan 1, 1990
7.503
+1.021
15.76%
jan 1, 1991
8.085
+0.582
7.76%
jan 1, 1992
8.462
+0.377
4.66%
jan 1, 1993
9.688
+1.227
14.5%
jan 1, 1994
10.388
+0.699
7.22%
jan 1, 1995
11.111
+0.724
6.97%
jan 1, 1996
11.451
+0.34
3.06%
jan 1, 1997
11.464
+0.013
0.11%
jan 1, 1998
11.936
+0.472
4.12%
jan 1, 1999
12.506
+0.57
4.78%
jan 1, 2000
13.099
+0.593
4.74%
jan 1, 2001
10.364
-2.734
-20.87%
jan 1, 2002
10.833
+0.468
4.52%
jan 1, 2003
12.318
+1.485
13.71%
jan 1, 2004
12.219
-0.099
-0.8%
jan 1, 2005
12.046
-0.173
-1.42%
jan 1, 2006
11.025
-1.021
-8.47%
jan 1, 2007
10.532
-0.493
-4.47%
jan 1, 2008
11.086
+0.555
5.27%
jan 1, 2009
11.182
+0.096
0.86%
jan 1, 2010
13.31
+2.127
19.03%
jan 1, 2011
14.601
+1.292
9.71%
jan 1, 2012
11.047
-3.555
-24.35%
jan 1, 2013
15.328
+4.282
38.76%
jan 1, 2014
16.58
+1.252
8.17%
jan 1, 2015
16.415
-0.165
-1.0%
Ranking of countries by current statistics by years


Comments: