29
/
en
AIzaSyAYiBZKx7MnpbEhh9jyipgxe19OcubqV5w
April 1, 2024
62794
World
WLD
false
2
1
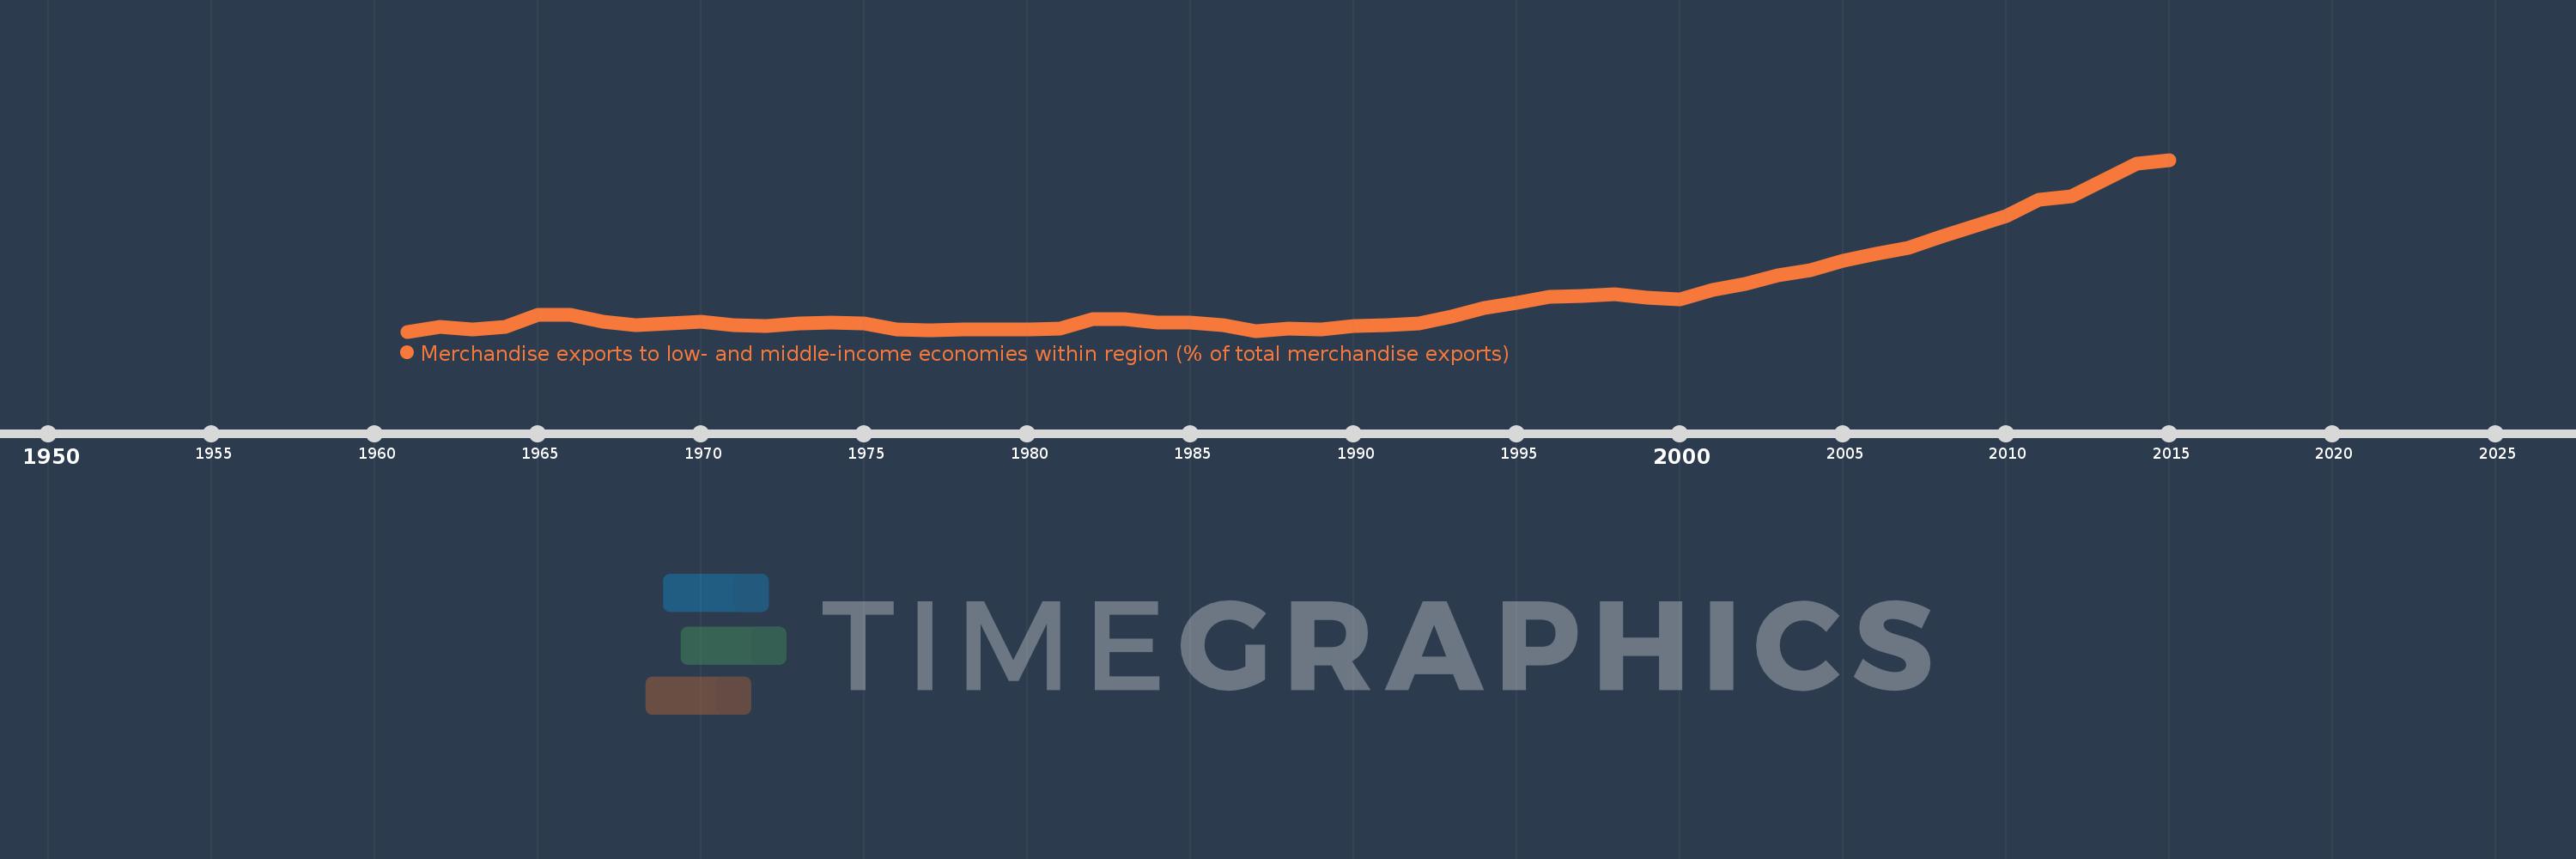
Merchandise exports to low- and middle-income economies within region (% of total merchandise exports)
2015,2014,2013,2012,2011,2010,2009,2008,2007,2006,2005,2004,2003,2002,2001,2000,1999,1998,1997,1996,1995,1994,1993,1992,1991,1990,1989,1988,1987,1986,1985,1984,1983,1982,1981,1980,1979,1978,1977,1976,1975,1974,1973,1972,1971,1970,1969,1968,1967,1966,1965,1964,1963,1962,1961
This statistics in other country:
Timeline:
This timeline shows a graph from 1961 to 2015 of World. No data until 1960. Number of actual observations by date: 55.
Source name:
World Development Indicators
Source organization:
World Bank staff estimates based data from International Monetary Fund's Direction of Trade database.
Categories, topics:
Private Sector, Trade
Last updated:
apr 23, 2017
Indicators value changes by year
At the date of observation
Value
Absolute change
Change from previous value
jan 1, 1961
0.601
+0.601
0.0%
jan 1, 1962
0.699
+0.098
16.3%
jan 1, 1963
0.641
-0.059
-8.39%
jan 1, 1964
0.693
+0.053
8.22%
jan 1, 1965
0.948
+0.255
36.73%
jan 1, 1966
0.941
-0.007
-0.73%
jan 1, 1967
0.806
-0.135
-14.38%
jan 1, 1968
0.737
-0.068
-8.49%
jan 1, 1969
0.769
+0.031
4.24%
jan 1, 1970
0.8
+0.032
4.11%
jan 1, 1971
0.736
-0.065
-8.07%
jan 1, 1972
0.708
-0.028
-3.76%
jan 1, 1973
0.77
+0.062
8.7%
jan 1, 1974
0.781
+0.011
1.45%
jan 1, 1975
0.764
-0.017
-2.19%
jan 1, 1976
0.648
-0.116
-15.13%
jan 1, 1977
0.624
-0.025
-3.8%
jan 1, 1978
0.65
+0.027
4.32%
jan 1, 1979
0.648
-0.003
-0.43%
jan 1, 1980
0.641
-0.007
-1.02%
jan 1, 1981
0.663
+0.022
3.5%
jan 1, 1982
0.856
+0.193
29.09%
jan 1, 1983
0.856
-0.001
-0.09%
jan 1, 1984
0.787
-0.069
-8.01%
jan 1, 1985
0.784
-0.003
-0.37%
jan 1, 1986
0.731
-0.054
-6.84%
jan 1, 1987
0.607
-0.124
-16.97%
jan 1, 1988
0.657
+0.051
8.36%
jan 1, 1989
0.64
-0.017
-2.6%
jan 1, 1990
0.72
+0.08
12.48%
jan 1, 1991
0.734
+0.013
1.85%
jan 1, 1992
0.769
+0.035
4.84%
jan 1, 1993
0.917
+0.148
19.29%
jan 1, 1994
1.085
+0.167
18.24%
jan 1, 1995
1.19
+0.105
9.68%
jan 1, 1996
1.314
+0.124
10.43%
jan 1, 1997
1.341
+0.027
2.06%
jan 1, 1998
1.365
+0.024
1.78%
jan 1, 1999
1.292
-0.073
-5.36%
jan 1, 2000
1.268
-0.024
-1.83%
jan 1, 2001
1.45
+0.182
14.34%
jan 1, 2002
1.572
+0.122
8.45%
jan 1, 2003
1.751
+0.179
11.36%
jan 1, 2004
1.858
+0.107
6.11%
jan 1, 2005
2.054
+0.196
10.55%
jan 1, 2006
2.196
+0.142
6.91%
jan 1, 2007
2.315
+0.12
5.44%
jan 1, 2008
2.54
+0.224
9.69%
jan 1, 2009
2.767
+0.227
8.95%
jan 1, 2010
2.98
+0.213
7.71%
jan 1, 2011
3.299
+0.319
10.7%
jan 1, 2012
3.372
+0.073
2.21%
jan 1, 2013
3.718
+0.346
10.27%
jan 1, 2014
4.041
+0.323
8.68%
jan 1, 2015
4.126
+0.085
2.1%
Ranking of countries by current statistics by years


Comments: