29
/
en
AIzaSyAYiBZKx7MnpbEhh9jyipgxe19OcubqV5w
April 1, 2024
45299
Low & middle income
LMY
false
2
1
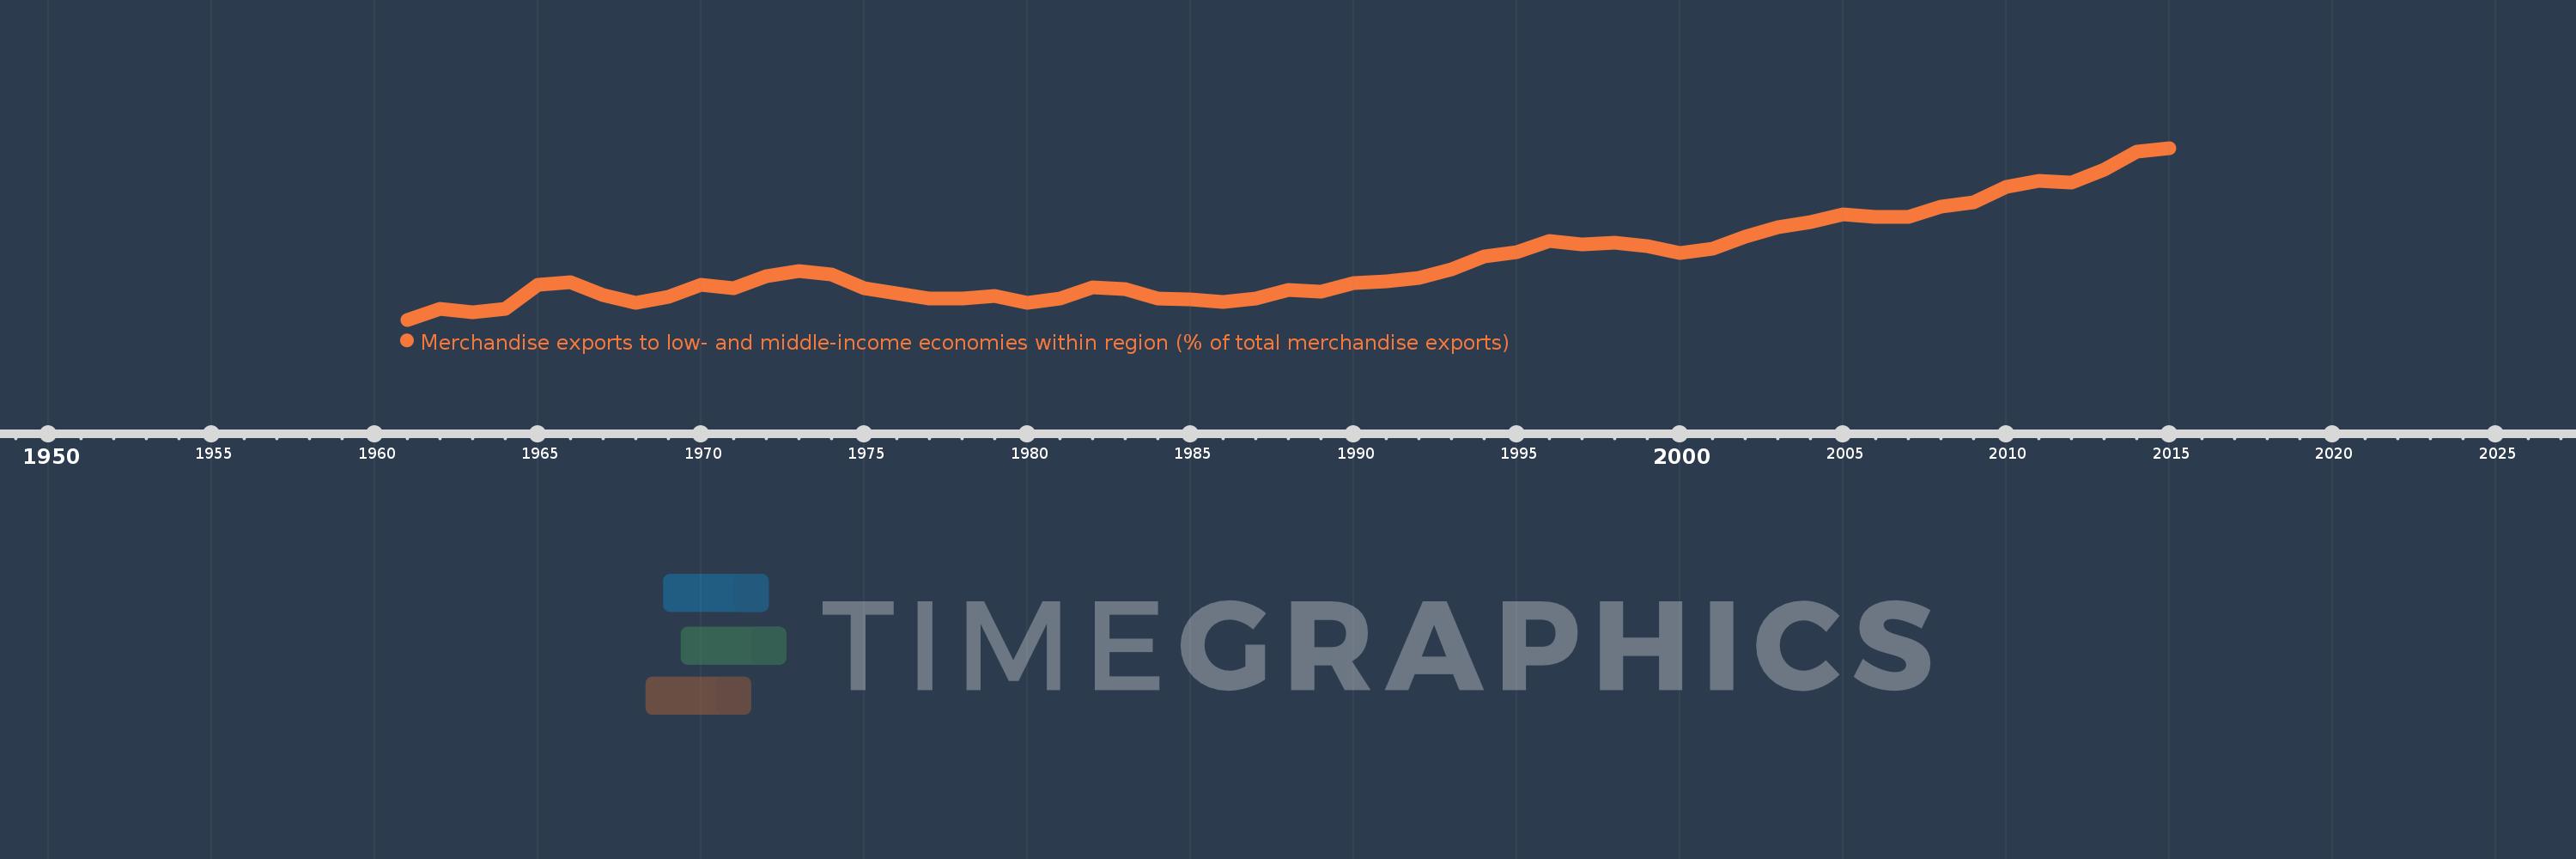
Merchandise exports to low- and middle-income economies within region (% of total merchandise exports)
2015,2014,2013,2012,2011,2010,2009,2008,2007,2006,2005,2004,2003,2002,2001,2000,1999,1998,1997,1996,1995,1994,1993,1992,1991,1990,1989,1988,1987,1986,1985,1984,1983,1982,1981,1980,1979,1978,1977,1976,1975,1974,1973,1972,1971,1970,1969,1968,1967,1966,1965,1964,1963,1962,1961
This statistics in other country:
Timeline:
This timeline shows a graph from 1961 to 2015 of Low & middle income. No data until 1960. Number of actual observations by date: 55.
Source name:
World Development Indicators
Source organization:
World Bank staff estimates based data from International Monetary Fund's Direction of Trade database.
Categories, topics:
Private Sector, Trade
Last updated:
apr 23, 2017
Indicators value changes by year
Maximum:
12.084
jan 1, 2015
At the date of observation
Value
Absolute change
Change from previous value
jan 1, 1961
3.308
+3.308
0.0%
jan 1, 1962
3.861
+0.553
16.73%
jan 1, 1963
3.67
-0.191
-4.94%
jan 1, 1964
3.869
+0.199
5.43%
jan 1, 1965
5.106
+1.236
31.95%
jan 1, 1966
5.245
+0.139
2.73%
jan 1, 1967
4.582
-0.663
-12.64%
jan 1, 1968
4.163
-0.419
-9.15%
jan 1, 1969
4.491
+0.329
7.9%
jan 1, 1970
5.072
+0.581
12.93%
jan 1, 1971
4.922
-0.15
-2.96%
jan 1, 1972
5.521
+0.599
12.18%
jan 1, 1973
5.793
+0.272
4.92%
jan 1, 1974
5.601
-0.192
-3.32%
jan 1, 1975
4.897
-0.704
-12.57%
jan 1, 1976
4.659
-0.237
-4.85%
jan 1, 1977
4.393
-0.267
-5.73%
jan 1, 1978
4.413
+0.02
0.46%
jan 1, 1979
4.529
+0.116
2.62%
jan 1, 1980
4.174
-0.355
-7.83%
jan 1, 1981
4.403
+0.229
5.49%
jan 1, 1982
4.971
+0.568
12.9%
jan 1, 1983
4.857
-0.114
-2.29%
jan 1, 1984
4.407
-0.45
-9.26%
jan 1, 1985
4.355
-0.052
-1.19%
jan 1, 1986
4.215
-0.14
-3.21%
jan 1, 1987
4.393
+0.177
4.21%
jan 1, 1988
4.811
+0.418
9.52%
jan 1, 1989
4.75
-0.061
-1.26%
jan 1, 1990
5.18
+0.43
9.05%
jan 1, 1991
5.268
+0.088
1.7%
jan 1, 1992
5.463
+0.195
3.7%
jan 1, 1993
5.867
+0.404
7.39%
jan 1, 1994
6.535
+0.668
11.39%
jan 1, 1995
6.743
+0.208
3.18%
jan 1, 1996
7.312
+0.569
8.44%
jan 1, 1997
7.135
-0.176
-2.41%
jan 1, 1998
7.224
+0.089
1.25%
jan 1, 1999
7.051
-0.174
-2.4%
jan 1, 2000
6.731
-0.32
-4.53%
jan 1, 2001
6.937
+0.206
3.07%
jan 1, 2002
7.567
+0.63
9.08%
jan 1, 2003
8.051
+0.484
6.39%
jan 1, 2004
8.301
+0.25
3.11%
jan 1, 2005
8.698
+0.396
4.78%
jan 1, 2006
8.579
-0.119
-1.37%
jan 1, 2007
8.55
-0.029
-0.33%
jan 1, 2008
9.076
+0.526
6.15%
jan 1, 2009
9.304
+0.228
2.51%
jan 1, 2010
10.089
+0.785
8.44%
jan 1, 2011
10.424
+0.335
3.32%
jan 1, 2012
10.307
-0.117
-1.12%
jan 1, 2013
10.967
+0.659
6.4%
jan 1, 2014
11.886
+0.92
8.39%
jan 1, 2015
12.084
+0.198
1.67%
Ranking of countries by current statistics by years


Comments: