29
/
en
AIzaSyAYiBZKx7MnpbEhh9jyipgxe19OcubqV5w
April 1, 2024
120111
Djibouti
DJI
true
2
1
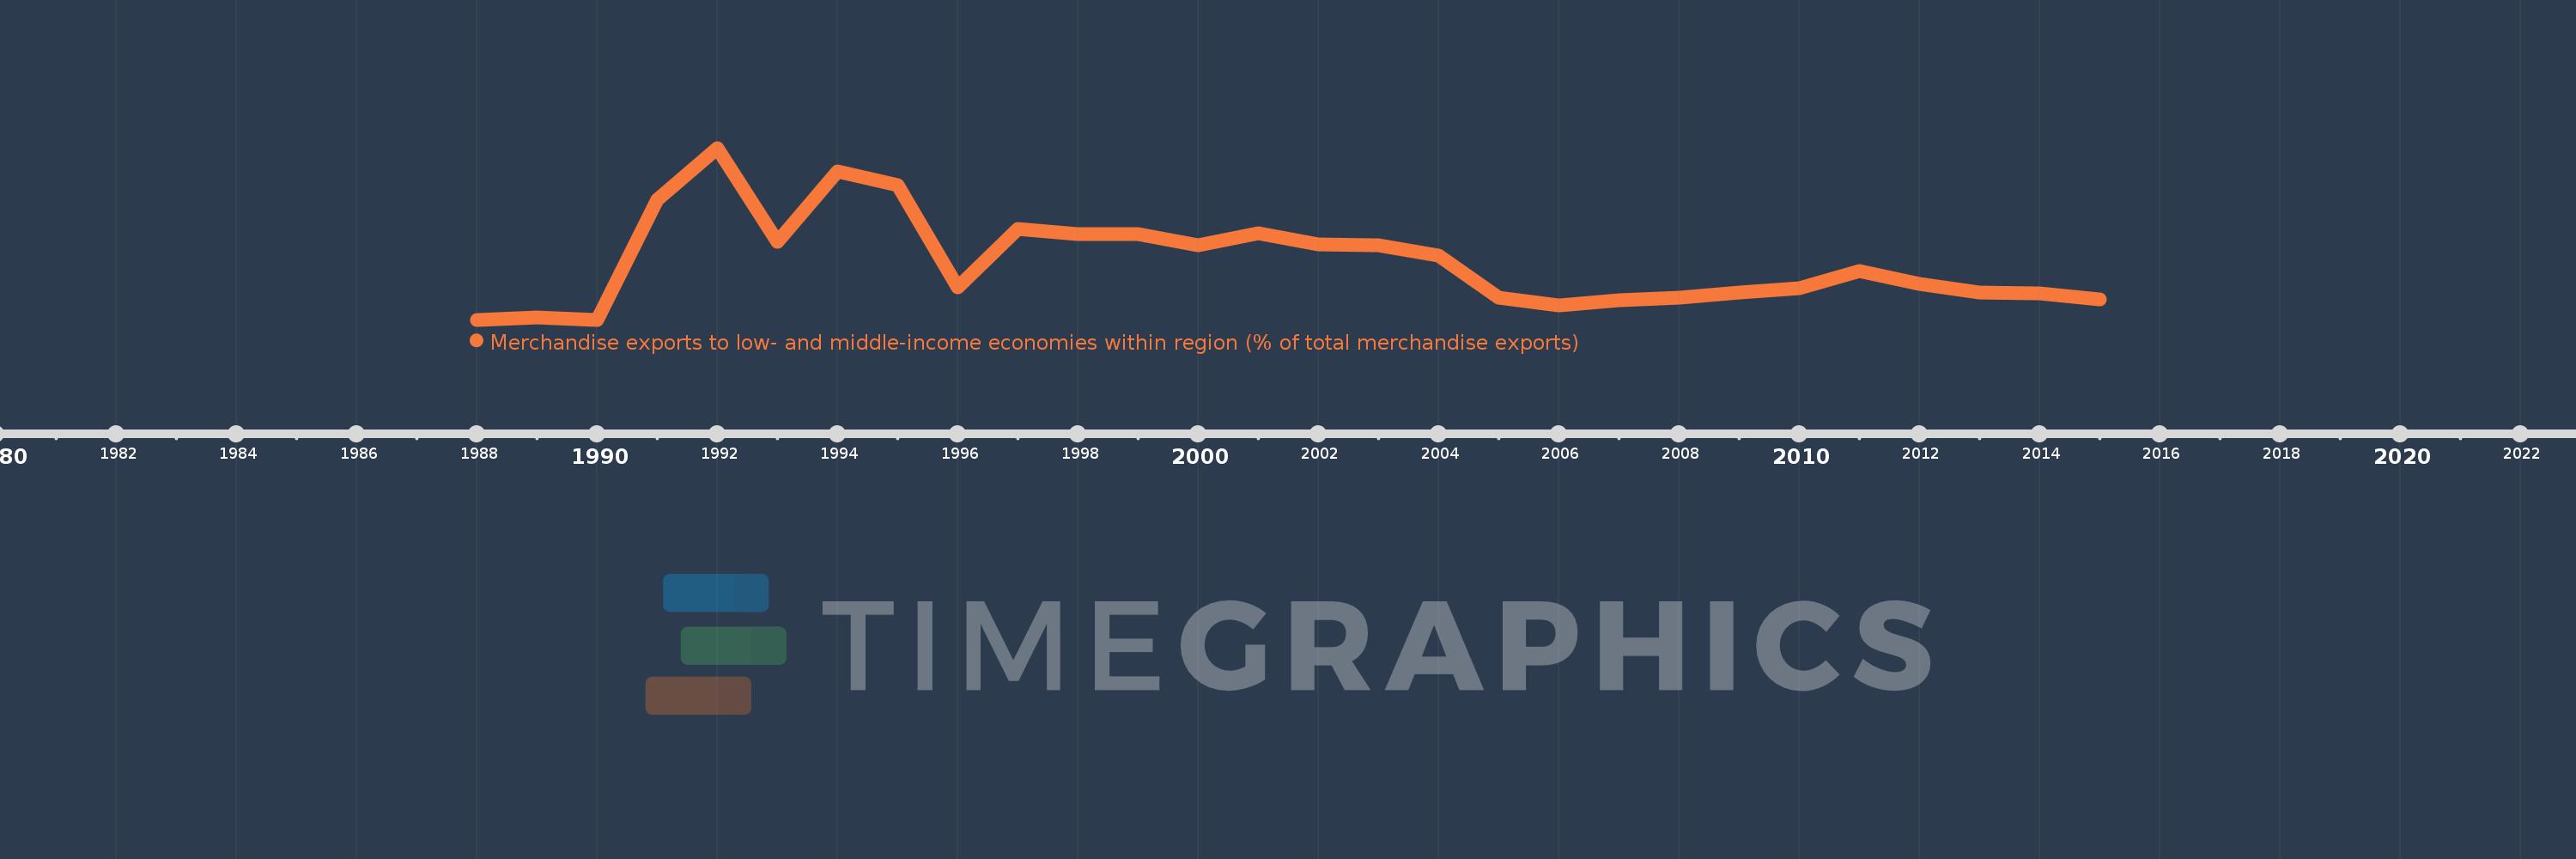
Merchandise exports to low- and middle-income economies within region (% of total merchandise exports)
2015,2014,2013,2012,2011,2010,2009,2008,2007,2006,2005,2004,2003,2002,2001,2000,1999,1998,1997,1996,1995,1994,1993,1992,1991,1990,1989,1988
This statistics in other country:
Timeline:
This timeline shows a graph from 1988 to 2015 of Djibouti. No data until 1987. Number of actual observations by date: 28.
Source name:
World Development Indicators
Source organization:
World Bank staff estimates based data from International Monetary Fund's Direction of Trade database.
Categories, topics:
Private Sector, Trade
Last updated:
apr 23, 2017
Indicators value changes by year
Maximum:
45.164
jan 1, 1992
At the date of observation
Value
Absolute change
Change from previous value
jan 1, 1989
0.715
+0.715
%
jan 1, 1990
0.0
-0.715
-100.0%
jan 1, 1991
31.444
+31.444
%
jan 1, 1992
45.164
+13.72
43.63%
jan 1, 1993
20.437
-24.727
-54.75%
jan 1, 1994
39.048
+18.611
91.07%
jan 1, 1995
35.368
-3.681
-9.43%
jan 1, 1996
8.596
-26.772
-75.7%
jan 1, 1997
23.799
+15.203
176.87%
jan 1, 1998
22.456
-1.343
-5.65%
jan 1, 1999
22.418
-0.037
-0.17%
jan 1, 2000
19.669
-2.749
-12.26%
jan 1, 2001
22.725
+3.056
15.54%
jan 1, 2002
19.693
-3.033
-13.35%
jan 1, 2003
19.468
-0.225
-1.14%
jan 1, 2004
16.863
-2.605
-13.38%
jan 1, 2005
5.737
-11.126
-65.98%
jan 1, 2006
3.856
-1.881
-32.79%
jan 1, 2007
5.02
+1.164
30.19%
jan 1, 2008
5.771
+0.752
14.97%
jan 1, 2009
7.238
+1.467
25.42%
jan 1, 2010
8.347
+1.109
15.32%
jan 1, 2011
12.866
+4.519
54.14%
jan 1, 2012
9.441
-3.425
-26.62%
jan 1, 2013
7.102
-2.339
-24.78%
jan 1, 2014
7.03
-0.072
-1.02%
jan 1, 2015
5.317
-1.713
-24.37%
Ranking of countries by current statistics by years


Comments: