29
/
en
AIzaSyAYiBZKx7MnpbEhh9jyipgxe19OcubqV5w
April 1, 2024
213242
Nigeria
NGA
true
2
1
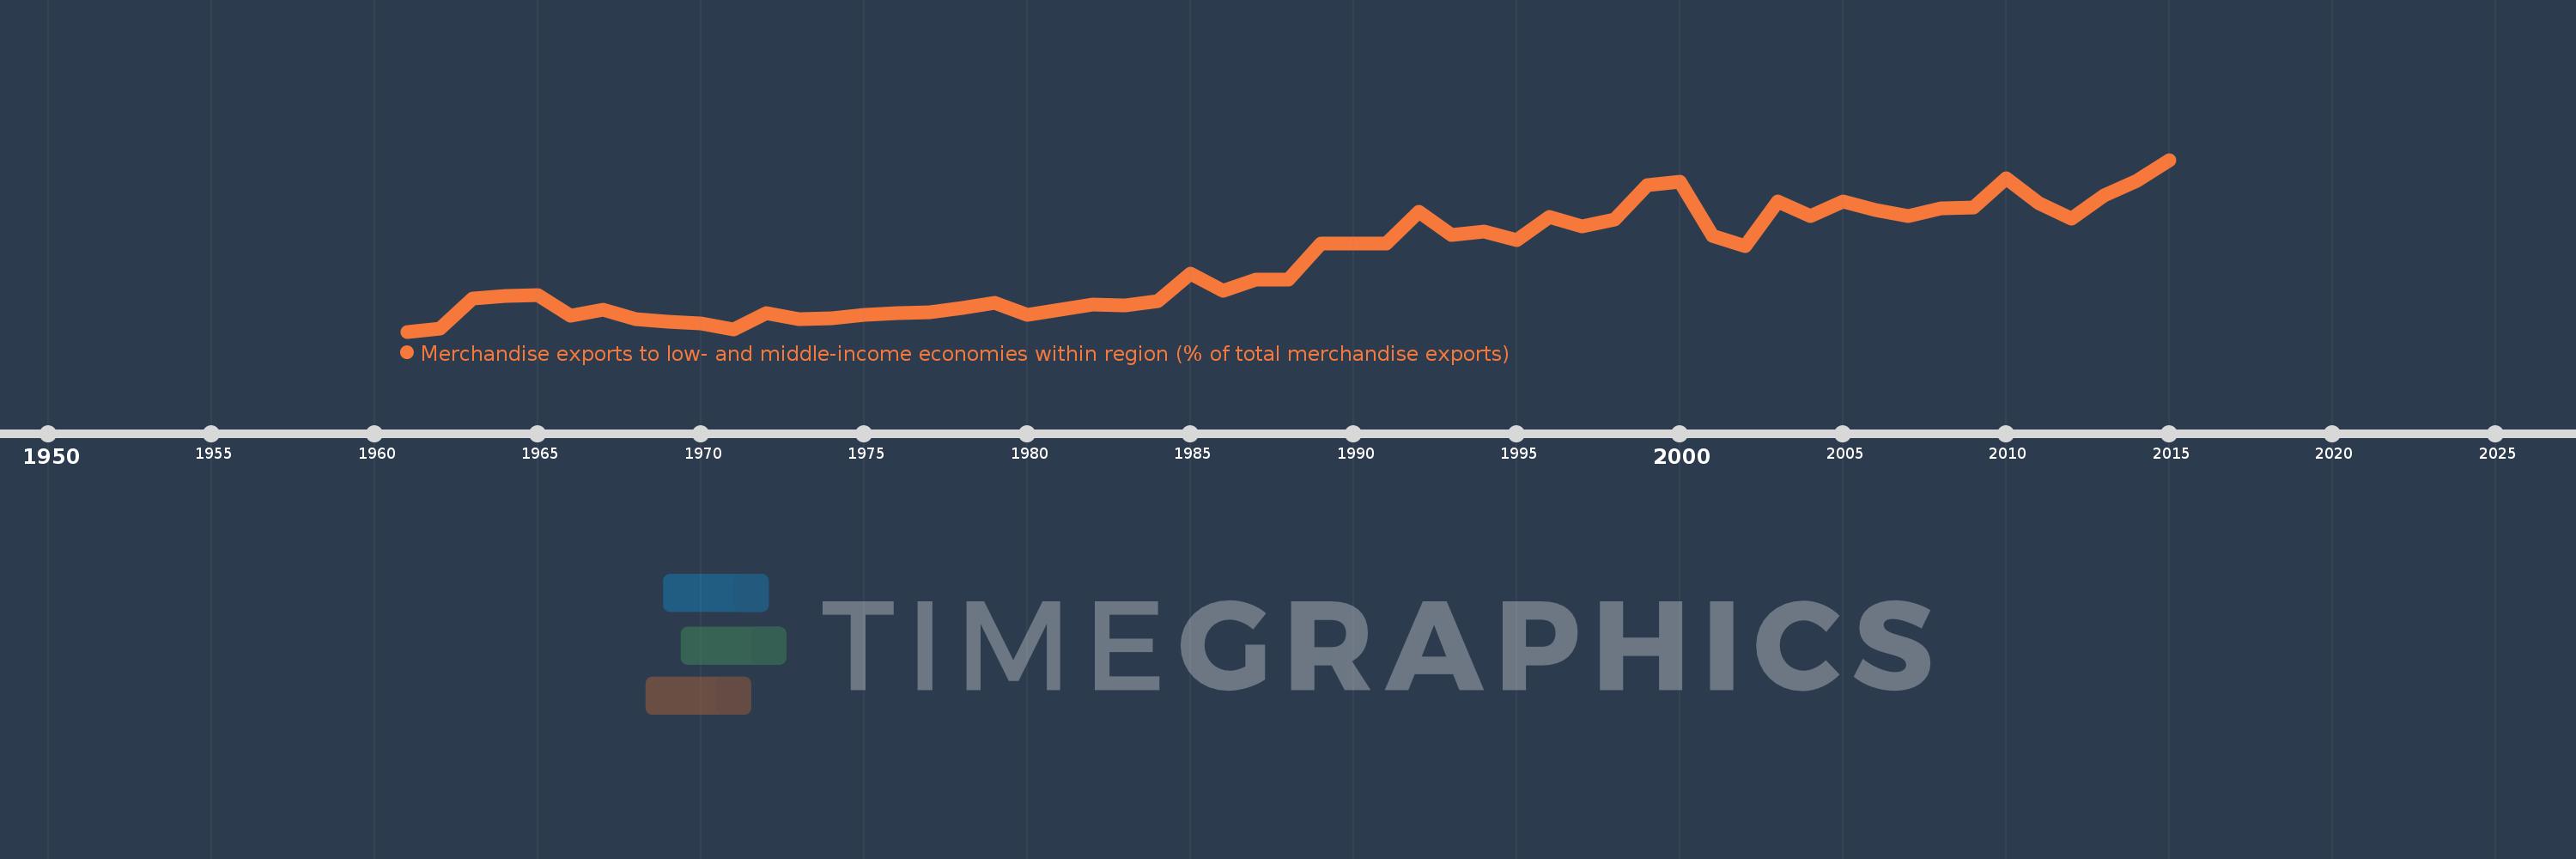
Merchandise exports to low- and middle-income economies within region (% of total merchandise exports)
2015,2014,2013,2012,2011,2010,2009,2008,2007,2006,2005,2004,2003,2002,2001,2000,1999,1998,1997,1996,1995,1994,1993,1992,1991,1990,1989,1988,1987,1986,1985,1984,1983,1982,1980,1979,1978,1977,1976,1975,1974,1973,1972,1971,1970,1969,1968,1967,1966,1965,1964,1963,1962,1961
This statistics in other country:
Timeline:
This timeline shows a graph from 1961 to 2015 of Nigeria. No data until 1960. Number of actual observations by date: 54.
Source name:
World Development Indicators
Source organization:
World Bank staff estimates based data from International Monetary Fund's Direction of Trade database.
Categories, topics:
Private Sector, Trade
Last updated:
apr 23, 2017
Indicators value changes by year
Maximum:
12.047
jan 1, 2015
At the date of observation
Value
Absolute change
Change from previous value
jan 1, 1961
0.693
+0.693
0.0%
jan 1, 1962
0.864
+0.171
24.74%
jan 1, 1963
2.907
+2.042
236.3%
jan 1, 1964
3.051
+0.145
4.97%
jan 1, 1965
3.094
+0.043
1.41%
jan 1, 1966
1.72
-1.374
-44.41%
jan 1, 1967
2.149
+0.428
24.9%
jan 1, 1968
1.505
-0.644
-29.95%
jan 1, 1969
1.351
-0.154
-10.23%
jan 1, 1970
1.257
-0.094
-6.93%
jan 1, 1971
0.863
-0.394
-31.34%
jan 1, 1972
1.895
+1.031
119.46%
jan 1, 1973
1.496
-0.399
-21.05%
jan 1, 1974
1.601
+0.105
7.0%
jan 1, 1975
1.777
+0.176
11.01%
jan 1, 1976
1.927
+0.151
8.48%
jan 1, 1977
1.947
+0.02
1.01%
jan 1, 1978
2.23
+0.283
14.52%
jan 1, 1979
2.575
+0.346
15.51%
jan 1, 1980
1.799
-0.776
-30.13%
jan 1, 1982
2.471
+0.671
37.31%
jan 1, 1983
2.398
-0.073
-2.96%
jan 1, 1984
2.683
+0.285
11.89%
jan 1, 1985
4.525
+1.842
68.66%
jan 1, 1986
3.367
-1.158
-25.59%
jan 1, 1987
4.148
+0.781
23.2%
jan 1, 1988
4.148
+0.0
0.0%
jan 1, 1989
6.508
+2.36
56.91%
jan 1, 1990
6.49
-0.018
-0.28%
jan 1, 1991
6.504
+0.014
0.22%
jan 1, 1992
8.594
+2.09
32.14%
jan 1, 1993
7.064
-1.53
-17.8%
jan 1, 1994
7.287
+0.223
3.16%
jan 1, 1995
6.73
-0.557
-7.65%
jan 1, 1996
8.288
+1.558
23.16%
jan 1, 1997
7.657
-0.631
-7.62%
jan 1, 1998
8.098
+0.441
5.76%
jan 1, 1999
10.389
+2.291
28.29%
jan 1, 2000
10.617
+0.227
2.19%
jan 1, 2001
7.001
-3.615
-34.05%
jan 1, 2002
6.352
-0.649
-9.27%
jan 1, 2003
9.321
+2.969
46.73%
jan 1, 2004
8.353
-0.968
-10.39%
jan 1, 2005
9.291
+0.938
11.23%
jan 1, 2006
8.753
-0.538
-5.79%
jan 1, 2007
8.315
-0.438
-5.01%
jan 1, 2008
8.835
+0.52
6.26%
jan 1, 2009
8.882
+0.047
0.53%
jan 1, 2010
10.845
+1.963
22.1%
jan 1, 2011
9.174
-1.671
-15.41%
jan 1, 2012
8.172
-1.002
-10.92%
jan 1, 2013
9.678
+1.506
18.42%
jan 1, 2014
10.644
+0.966
9.98%
jan 1, 2015
12.047
+1.403
13.18%
Ranking of countries by current statistics by years


Comments: