29
/
en
AIzaSyAYiBZKx7MnpbEhh9jyipgxe19OcubqV5w
April 1, 2024
150668
Honduras
HND
true
2
1
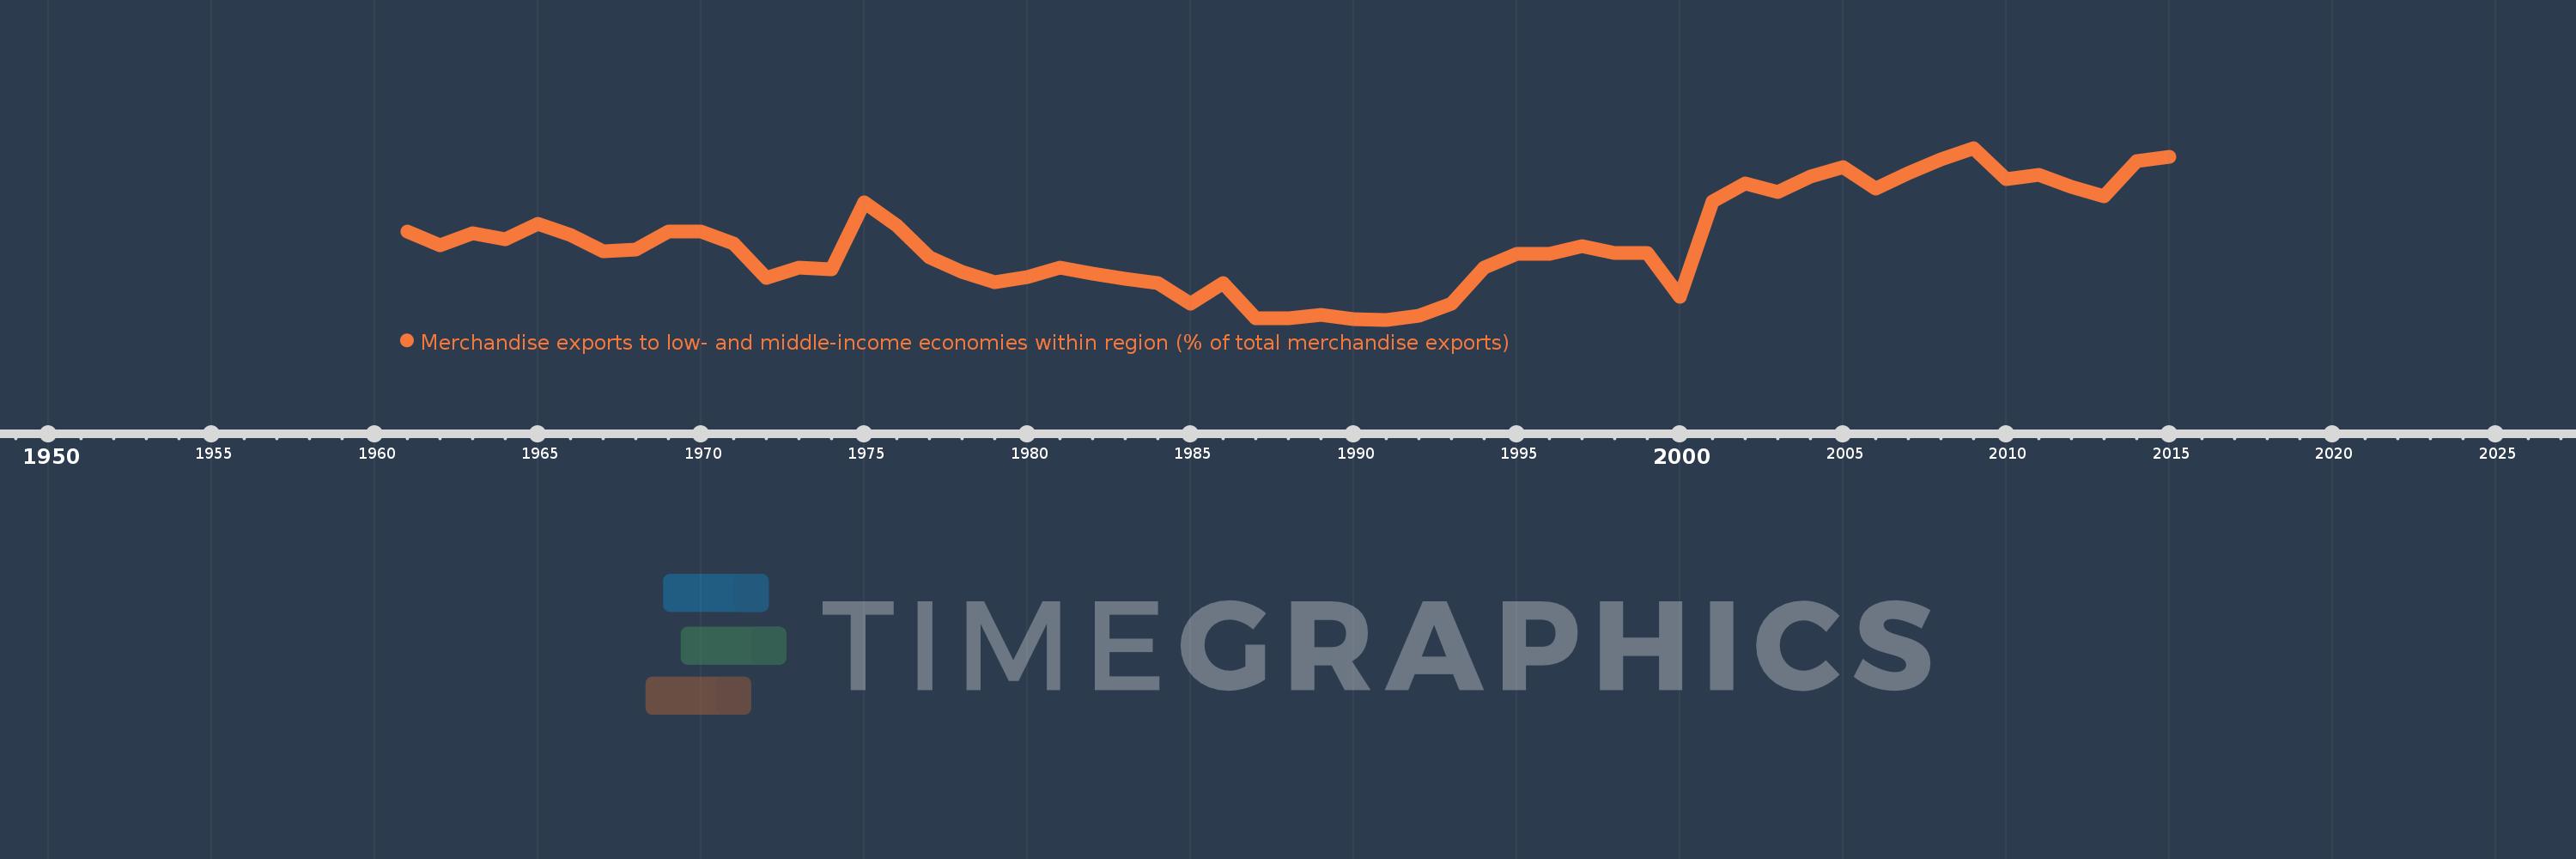
Merchandise exports to low- and middle-income economies within region (% of total merchandise exports)
2015,2014,2013,2012,2011,2010,2009,2008,2007,2006,2005,2004,2003,2002,2001,2000,1999,1998,1997,1996,1995,1994,1993,1992,1991,1990,1989,1988,1987,1986,1985,1984,1983,1982,1981,1980,1979,1978,1977,1976,1975,1974,1973,1972,1971,1970,1969,1968,1967,1966,1965,1964,1963,1962,1961
This statistics in other country:
Timeline:
This timeline shows a graph from 1961 to 2015 of Honduras. No data until 1960. Number of actual observations by date: 55.
Source name:
World Development Indicators
Source organization:
World Bank staff estimates based data from International Monetary Fund's Direction of Trade database.
Categories, topics:
Private Sector, Trade
Last updated:
apr 23, 2017
Indicators value changes by year
Maximum:
33.634
jan 1, 2009
At the date of observation
Value
Absolute change
Change from previous value
jan 1, 1961
19.129
+19.129
0.0%
jan 1, 1962
16.741
-2.388
-12.49%
jan 1, 1963
18.75
+2.009
12.0%
jan 1, 1964
17.711
-1.039
-5.54%
jan 1, 1965
20.419
+2.708
15.29%
jan 1, 1966
18.46
-1.959
-9.59%
jan 1, 1967
15.721
-2.739
-14.84%
jan 1, 1968
16.026
+0.305
1.94%
jan 1, 1969
19.121
+3.096
19.32%
jan 1, 1970
19.121
-0.001
0.0%
jan 1, 1971
17.09
-2.031
-10.62%
jan 1, 1972
11.066
-6.024
-35.25%
jan 1, 1973
12.888
+1.823
16.47%
jan 1, 1974
12.567
-0.321
-2.49%
jan 1, 1975
24.2
+11.633
92.56%
jan 1, 1976
20.163
-4.037
-16.68%
jan 1, 1977
14.685
-5.478
-27.17%
jan 1, 1978
12.047
-2.638
-17.96%
jan 1, 1979
10.357
-1.689
-14.02%
jan 1, 1980
11.264
+0.907
8.76%
jan 1, 1981
12.861
+1.597
14.18%
jan 1, 1982
11.867
-0.994
-7.73%
jan 1, 1983
10.847
-1.02
-8.6%
jan 1, 1984
10.227
-0.62
-5.72%
jan 1, 1985
6.636
-3.59
-35.11%
jan 1, 1986
10.227
+3.59
54.1%
jan 1, 1987
3.994
-6.233
-60.95%
jan 1, 1988
4.056
+0.062
1.56%
jan 1, 1989
4.577
+0.521
12.84%
jan 1, 1990
3.831
-0.746
-16.3%
jan 1, 1991
3.779
-0.052
-1.35%
jan 1, 1992
4.424
+0.645
17.06%
jan 1, 1993
6.571
+2.148
48.55%
jan 1, 1994
12.846
+6.275
95.5%
jan 1, 1995
15.225
+2.378
18.51%
jan 1, 1996
15.247
+0.022
0.15%
jan 1, 1997
16.549
+1.303
8.54%
jan 1, 1998
15.363
-1.187
-7.17%
jan 1, 1999
15.304
-0.058
-0.38%
jan 1, 2000
7.718
-7.586
-49.57%
jan 1, 2001
24.308
+16.59
214.94%
jan 1, 2002
27.476
+3.168
13.03%
jan 1, 2003
25.919
-1.557
-5.67%
jan 1, 2004
28.616
+2.696
10.4%
jan 1, 2005
30.268
+1.653
5.78%
jan 1, 2006
26.575
-3.694
-12.2%
jan 1, 2007
29.203
+2.628
9.89%
jan 1, 2008
31.62
+2.416
8.27%
jan 1, 2009
33.634
+2.015
6.37%
jan 1, 2010
28.257
-5.377
-15.99%
jan 1, 2011
28.992
+0.735
2.6%
jan 1, 2012
26.862
-2.13
-7.35%
jan 1, 2013
25.231
-1.632
-6.07%
jan 1, 2014
31.281
+6.05
23.98%
jan 1, 2015
32.085
+0.804
2.57%
Ranking of countries by current statistics by years


Comments: