29
/
en
AIzaSyAYiBZKx7MnpbEhh9jyipgxe19OcubqV5w
April 1, 2024
54224
Pacific island small states
PSS
false
2
1
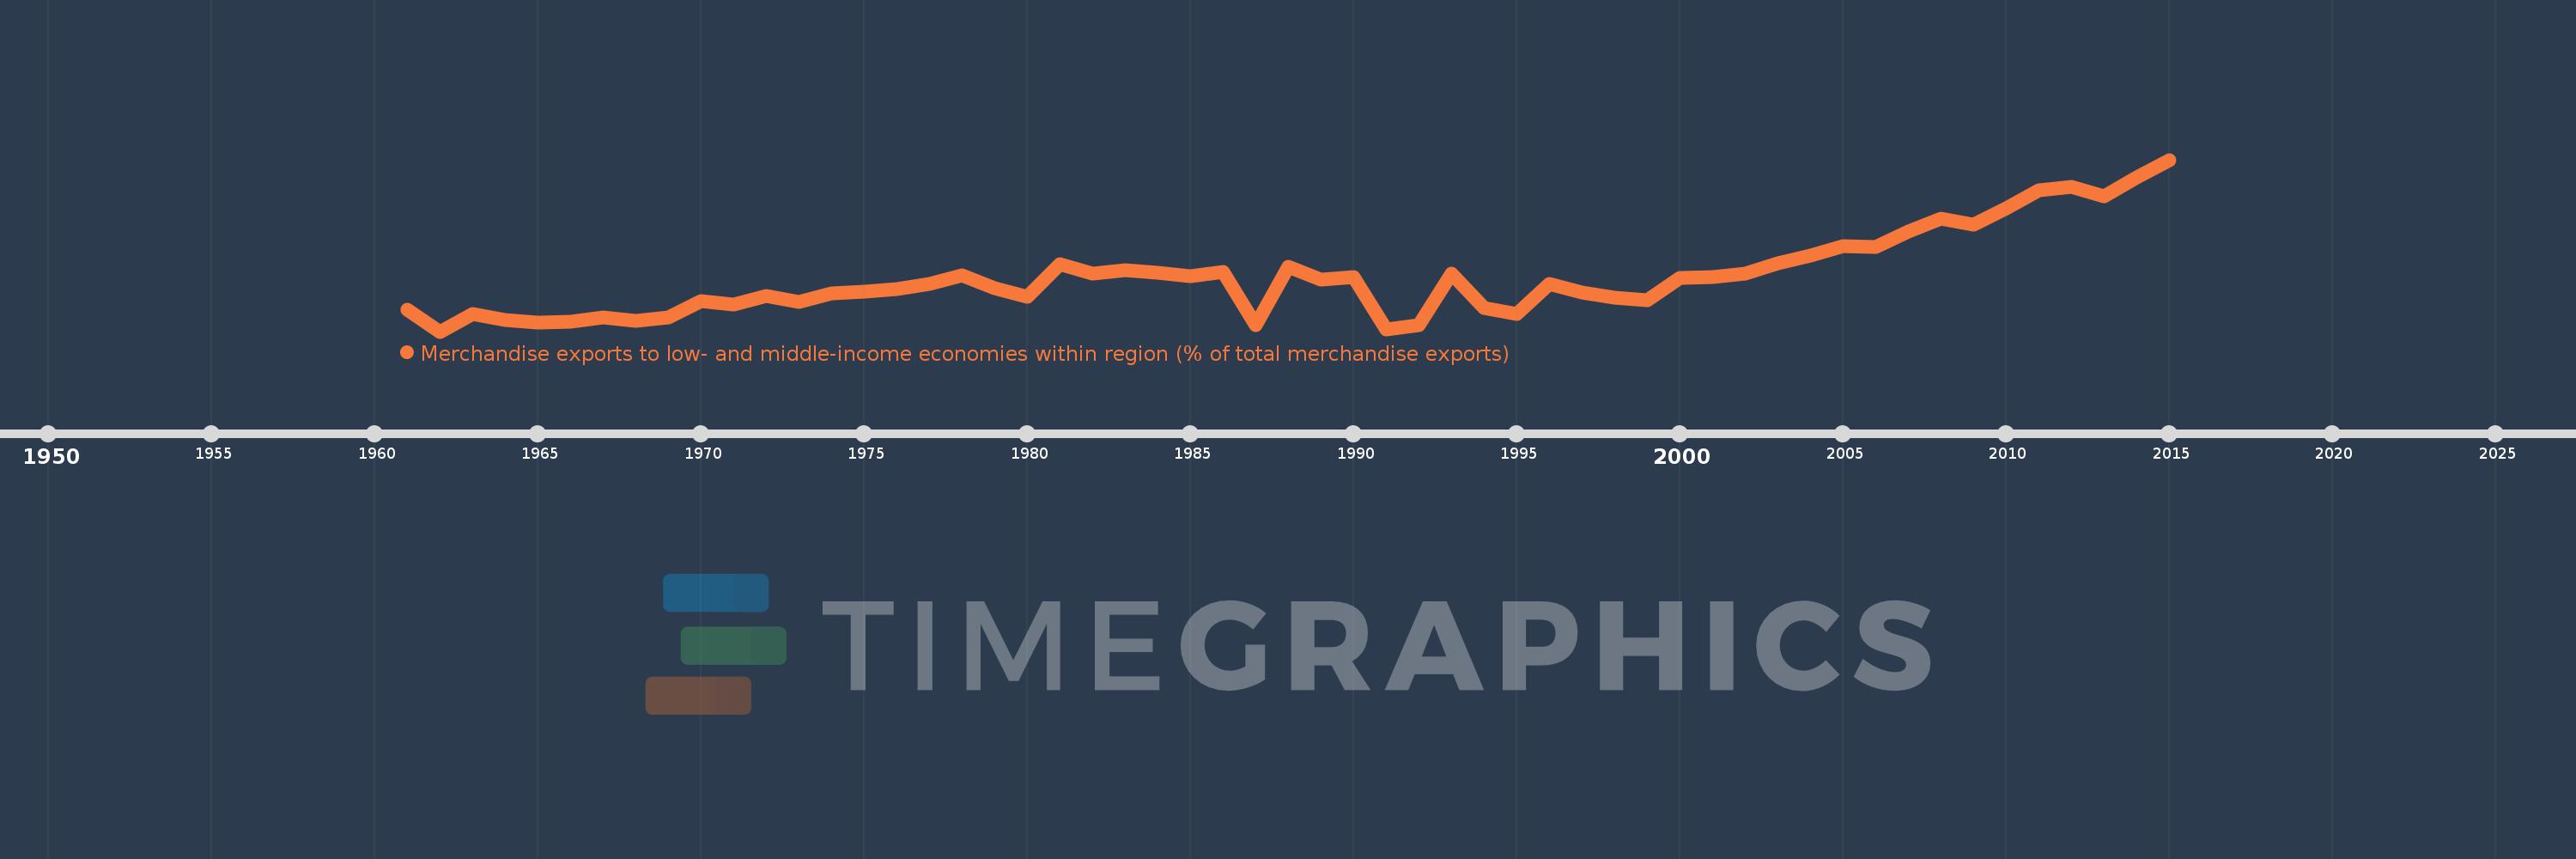
Merchandise exports to low- and middle-income economies within region (% of total merchandise exports)
2015,2014,2013,2012,2011,2010,2009,2008,2007,2006,2005,2004,2003,2002,2001,2000,1999,1998,1997,1996,1995,1994,1993,1992,1991,1990,1989,1988,1987,1986,1985,1984,1983,1982,1981,1980,1979,1978,1977,1976,1975,1974,1973,1972,1971,1970,1969,1968,1967,1966,1965,1964,1963,1962,1961
This statistics in other country:
Timeline:
This timeline shows a graph from 1961 to 2015 of Pacific island small states. No data until 1960. Number of actual observations by date: 55.
Source name:
World Development Indicators
Source organization:
World Bank staff estimates based data from International Monetary Fund's Direction of Trade database.
Categories, topics:
Private Sector, Trade
Last updated:
apr 23, 2017
Indicators value changes by year
Maximum:
34.305
jan 1, 2015
At the date of observation
Value
Absolute change
Change from previous value
jan 1, 1961
4.304
+4.304
0.0%
jan 1, 1962
0.0
-4.304
-100.0%
jan 1, 1963
3.526
+3.526
%
jan 1, 1964
2.342
-1.184
-33.58%
jan 1, 1965
1.778
-0.564
-24.07%
jan 1, 1966
1.897
+0.119
6.68%
jan 1, 1967
2.822
+0.925
48.75%
jan 1, 1968
2.139
-0.683
-24.2%
jan 1, 1969
2.848
+0.708
33.12%
jan 1, 1970
6.026
+3.178
111.61%
jan 1, 1971
5.409
-0.616
-10.23%
jan 1, 1972
7.085
+1.676
30.99%
jan 1, 1973
5.872
-1.213
-17.12%
jan 1, 1974
7.549
+1.677
28.56%
jan 1, 1975
7.91
+0.36
4.77%
jan 1, 1976
8.471
+0.562
7.1%
jan 1, 1977
9.529
+1.058
12.49%
jan 1, 1978
11.295
+1.766
18.54%
jan 1, 1979
8.589
-2.706
-23.96%
jan 1, 1980
6.881
-1.708
-19.89%
jan 1, 1981
13.521
+6.64
96.5%
jan 1, 1982
11.629
-1.892
-13.99%
jan 1, 1983
12.229
+0.6
5.16%
jan 1, 1984
11.816
-0.413
-3.38%
jan 1, 1985
11.102
-0.714
-6.04%
jan 1, 1986
11.885
+0.783
7.05%
jan 1, 1987
1.268
-10.617
-89.33%
jan 1, 1988
12.871
+11.603
914.75%
jan 1, 1989
10.295
-2.576
-20.02%
jan 1, 1990
10.818
+0.523
5.08%
jan 1, 1991
0.514
-10.304
-95.25%
jan 1, 1992
1.321
+0.807
156.92%
jan 1, 1993
11.51
+10.189
771.05%
jan 1, 1994
4.634
-6.876
-59.74%
jan 1, 1995
3.472
-1.162
-25.08%
jan 1, 1996
9.434
+5.962
171.74%
jan 1, 1997
7.847
-1.587
-16.82%
jan 1, 1998
6.796
-1.051
-13.39%
jan 1, 1999
6.178
-0.618
-9.1%
jan 1, 2000
10.696
+4.518
73.13%
jan 1, 2001
10.85
+0.154
1.44%
jan 1, 2002
11.633
+0.783
7.21%
jan 1, 2003
13.615
+1.982
17.04%
jan 1, 2004
15.105
+1.49
10.95%
jan 1, 2005
17.024
+1.919
12.7%
jan 1, 2006
16.814
-0.211
-1.24%
jan 1, 2007
19.935
+3.121
18.56%
jan 1, 2008
22.538
+2.603
13.06%
jan 1, 2009
21.284
-1.254
-5.56%
jan 1, 2010
24.665
+3.38
15.88%
jan 1, 2011
28.237
+3.573
14.49%
jan 1, 2012
28.951
+0.714
2.53%
jan 1, 2013
27.059
-1.892
-6.54%
jan 1, 2014
30.794
+3.734
13.8%
jan 1, 2015
34.305
+3.511
11.4%
Ranking of countries by current statistics by years


Comments: