29
/
en
AIzaSyAYiBZKx7MnpbEhh9jyipgxe19OcubqV5w
April 1, 2024
28336
East Asia & Pacific (excluding high income)
EAP
false
2
1
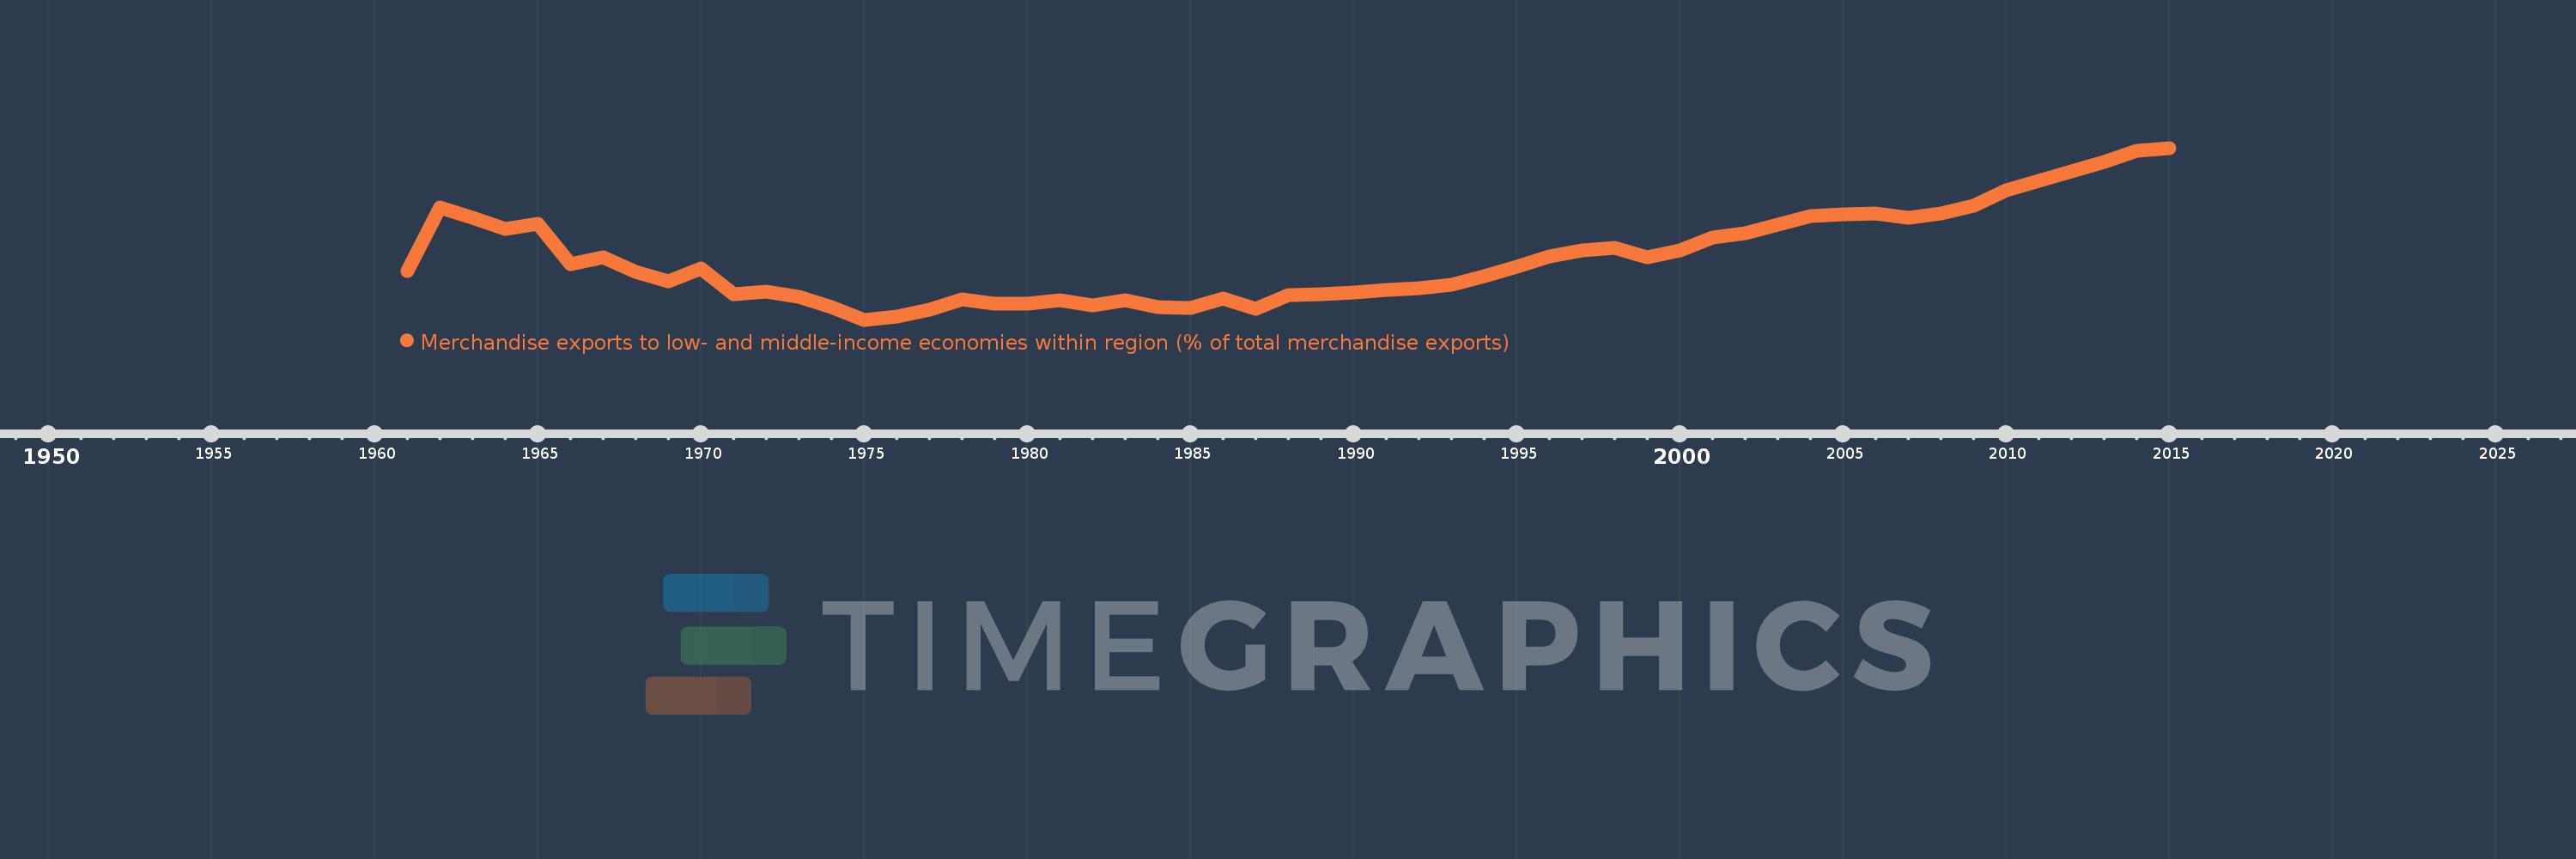
Merchandise exports to low- and middle-income economies within region (% of total merchandise exports)
2015,2014,2013,2012,2011,2010,2009,2008,2007,2006,2005,2004,2003,2002,2001,2000,1999,1998,1997,1996,1995,1994,1993,1992,1991,1990,1989,1988,1987,1986,1985,1984,1983,1982,1981,1980,1979,1978,1977,1976,1975,1974,1973,1972,1971,1970,1969,1968,1967,1966,1965,1964,1963,1962,1961
This statistics in other country:
Timeline:
This timeline shows a graph from 1961 to 2015 of East Asia & Pacific (excluding high income). No data until 1960. Number of actual observations by date: 55.
Source name:
World Development Indicators
Source organization:
World Bank staff estimates based data from International Monetary Fund's Direction of Trade database.
Categories, topics:
Private Sector, Trade
Last updated:
apr 23, 2017
Indicators value changes by year
Maximum:
14.527
jan 1, 2015
At the date of observation
Value
Absolute change
Change from previous value
jan 1, 1961
6.822
+6.822
0.0%
jan 1, 1962
10.804
+3.982
58.38%
jan 1, 1963
10.174
-0.63
-5.83%
jan 1, 1964
9.493
-0.681
-6.7%
jan 1, 1965
9.804
+0.311
3.28%
jan 1, 1966
7.281
-2.523
-25.73%
jan 1, 1967
7.685
+0.404
5.55%
jan 1, 1968
6.786
-0.899
-11.7%
jan 1, 1969
6.195
-0.591
-8.71%
jan 1, 1970
7.007
+0.812
13.11%
jan 1, 1971
5.392
-1.615
-23.04%
jan 1, 1972
5.56
+0.168
3.11%
jan 1, 1973
5.235
-0.325
-5.84%
jan 1, 1974
4.575
-0.66
-12.6%
jan 1, 1975
3.802
-0.773
-16.9%
jan 1, 1976
3.997
+0.195
5.12%
jan 1, 1977
4.409
+0.413
10.33%
jan 1, 1978
5.086
+0.677
15.34%
jan 1, 1979
4.791
-0.295
-5.81%
jan 1, 1980
4.809
+0.019
0.39%
jan 1, 1981
5.025
+0.216
4.49%
jan 1, 1982
4.684
-0.341
-6.79%
jan 1, 1983
5.002
+0.318
6.8%
jan 1, 1984
4.61
-0.392
-7.84%
jan 1, 1985
4.551
-0.059
-1.28%
jan 1, 1986
5.119
+0.568
12.48%
jan 1, 1987
4.486
-0.633
-12.37%
jan 1, 1988
5.328
+0.842
18.78%
jan 1, 1989
5.419
+0.091
1.71%
jan 1, 1990
5.48
+0.06
1.11%
jan 1, 1991
5.689
+0.209
3.82%
jan 1, 1992
5.769
+0.08
1.41%
jan 1, 1993
5.985
+0.217
3.76%
jan 1, 1994
6.498
+0.512
8.56%
jan 1, 1995
7.102
+0.604
9.3%
jan 1, 1996
7.773
+0.671
9.45%
jan 1, 1997
8.14
+0.367
4.72%
jan 1, 1998
8.285
+0.144
1.77%
jan 1, 1999
7.722
-0.563
-6.8%
jan 1, 2000
8.109
+0.388
5.02%
jan 1, 2001
8.934
+0.825
10.17%
jan 1, 2002
9.183
+0.249
2.79%
jan 1, 2003
9.74
+0.557
6.07%
jan 1, 2004
10.249
+0.509
5.23%
jan 1, 2005
10.406
+0.157
1.53%
jan 1, 2006
10.418
+0.012
0.12%
jan 1, 2007
10.151
-0.267
-2.56%
jan 1, 2008
10.436
+0.285
2.8%
jan 1, 2009
10.903
+0.467
4.48%
jan 1, 2010
11.888
+0.985
9.04%
jan 1, 2011
12.448
+0.56
4.71%
jan 1, 2012
13.052
+0.604
4.85%
jan 1, 2013
13.658
+0.606
4.65%
jan 1, 2014
14.35
+0.692
5.07%
jan 1, 2015
14.527
+0.177
1.23%
Ranking of countries by current statistics by years


Comments: