29
/
en
AIzaSyAYiBZKx7MnpbEhh9jyipgxe19OcubqV5w
April 1, 2024
33636
European Union
EUU
false
2
1
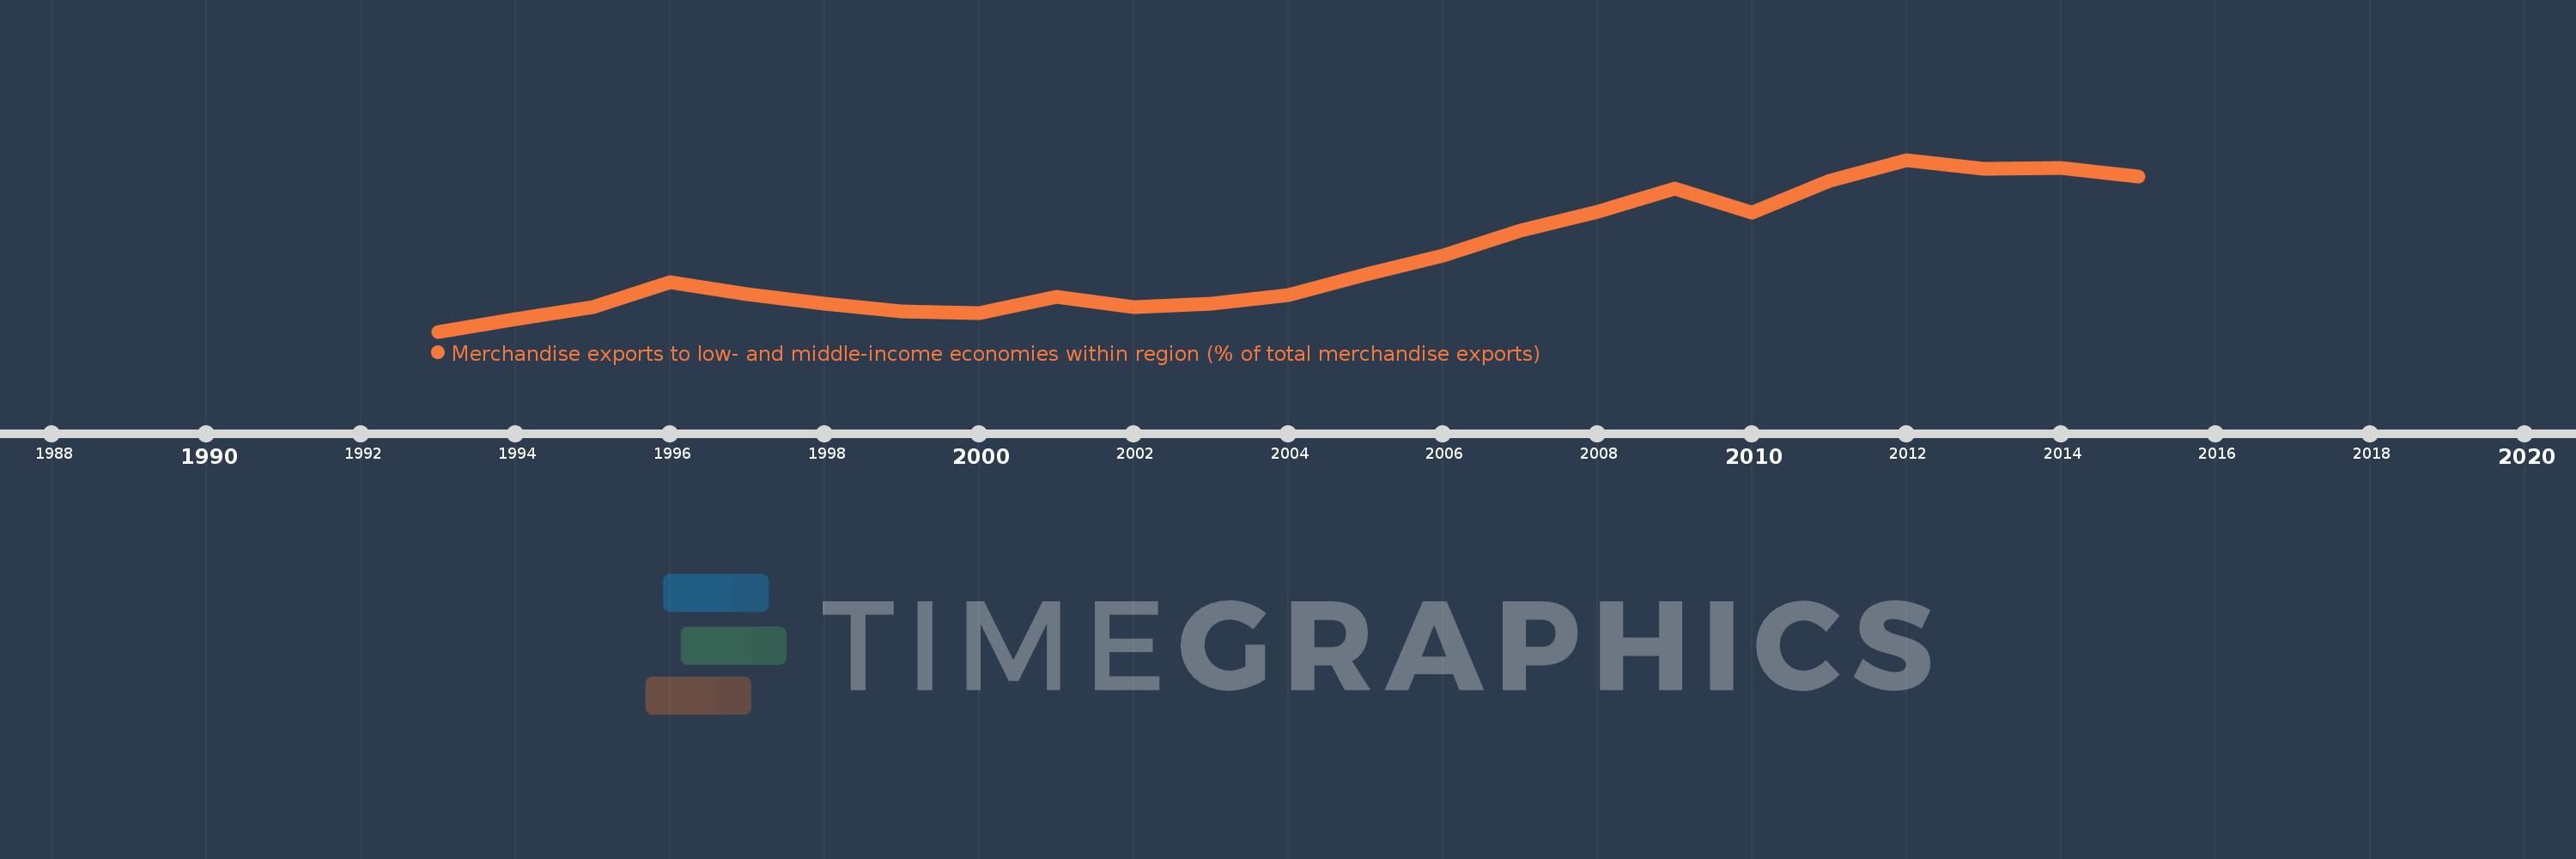
Merchandise exports to low- and middle-income economies within region (% of total merchandise exports)
2015,2014,2013,2012,2011,2010,2009,2008,2007,2006,2005,2004,2003,2002,2001,2000,1999,1998,1997,1996,1995,1994,1993
This statistics in other country:
Timeline:
This timeline shows a graph from 1993 to 2015 of European Union. No data until 1992. Number of actual observations by date: 23.
Source name:
World Development Indicators
Source organization:
World Bank staff estimates based data from International Monetary Fund's Direction of Trade database.
Categories, topics:
Private Sector, Trade
Last updated:
apr 23, 2017
Indicators value changes by year
At the date of observation
Value
Absolute change
Change from previous value
jan 1, 1993
0.036
+0.036
0.0%
jan 1, 1994
0.054
+0.018
51.09%
jan 1, 1995
0.072
+0.019
34.91%
jan 1, 1996
0.109
+0.036
50.22%
jan 1, 1997
0.092
-0.017
-15.66%
jan 1, 1998
0.078
-0.014
-14.97%
jan 1, 1999
0.066
-0.012
-15.21%
jan 1, 2000
0.063
-0.003
-4.06%
jan 1, 2001
0.088
+0.024
38.02%
jan 1, 2002
0.072
-0.015
-17.35%
jan 1, 2003
0.077
+0.004
6.14%
jan 1, 2004
0.09
+0.013
16.83%
jan 1, 2005
0.121
+0.031
34.85%
jan 1, 2006
0.149
+0.028
23.46%
jan 1, 2007
0.186
+0.036
24.42%
jan 1, 2008
0.215
+0.029
15.64%
jan 1, 2009
0.249
+0.034
15.81%
jan 1, 2010
0.213
-0.036
-14.47%
jan 1, 2011
0.261
+0.048
22.35%
jan 1, 2012
0.292
+0.032
12.15%
jan 1, 2013
0.278
-0.014
-4.93%
jan 1, 2014
0.28
+0.002
0.8%
jan 1, 2015
0.267
-0.013
-4.52%
Ranking of countries by current statistics by years


Comments: