29
/
en
AIzaSyAYiBZKx7MnpbEhh9jyipgxe19OcubqV5w
April 1, 2024
51122
Middle income
MIC
false
2
1
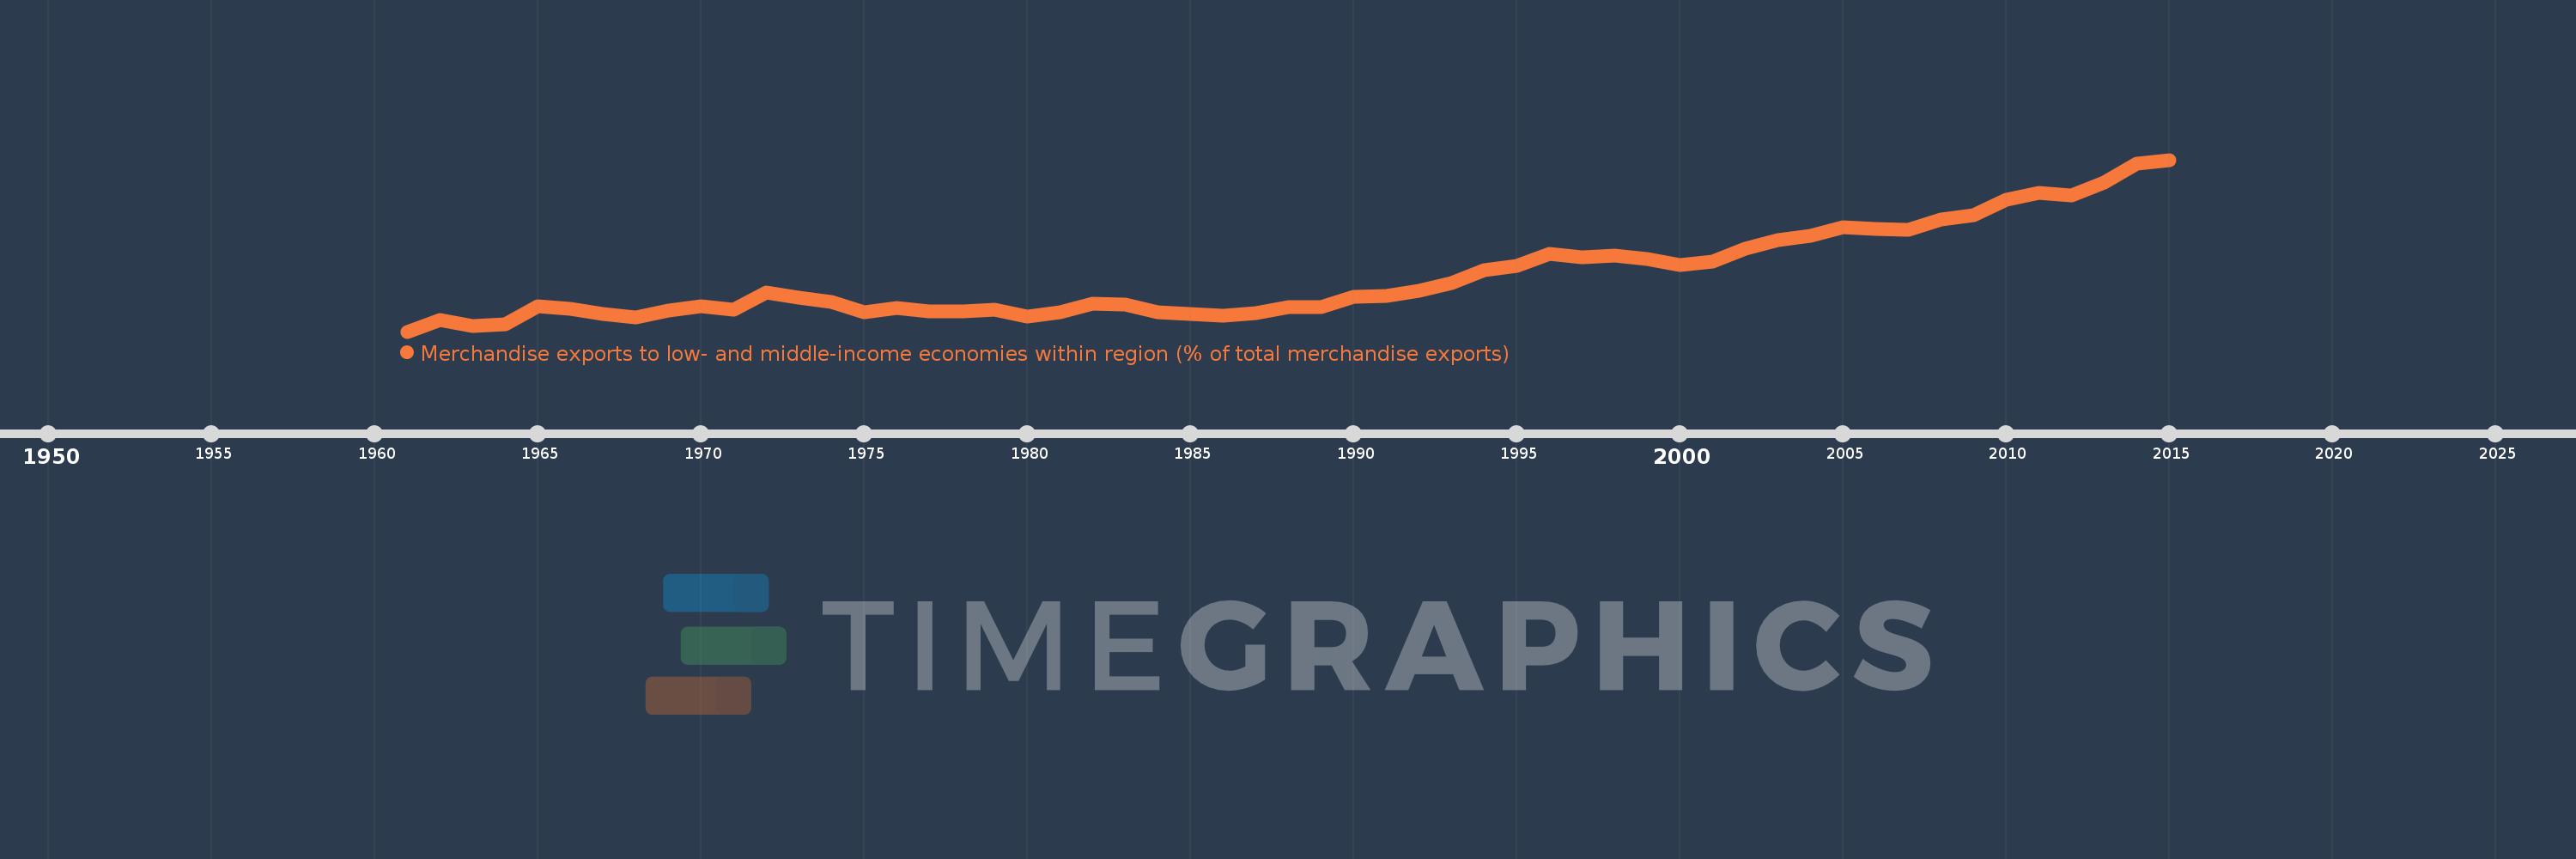
Merchandise exports to low- and middle-income economies within region (% of total merchandise exports)
2015,2014,2013,2012,2011,2010,2009,2008,2007,2006,2005,2004,2003,2002,2001,2000,1999,1998,1997,1996,1995,1994,1993,1992,1991,1990,1989,1988,1987,1986,1985,1984,1983,1982,1981,1980,1979,1978,1977,1976,1975,1974,1973,1972,1971,1970,1969,1968,1967,1966,1965,1964,1963,1962,1961
This statistics in other country:
Timeline:
This timeline shows a graph from 1961 to 2015 of Middle income. No data until 1960. Number of actual observations by date: 55.
Source name:
World Development Indicators
Source organization:
World Bank staff estimates based data from International Monetary Fund's Direction of Trade database.
Categories, topics:
Private Sector, Trade
Last updated:
apr 23, 2017
Indicators value changes by year
Maximum:
11.984
jan 1, 2015
At the date of observation
Value
Absolute change
Change from previous value
jan 1, 1961
3.292
+3.292
0.0%
jan 1, 1962
3.865
+0.573
17.4%
jan 1, 1963
3.592
-0.273
-7.08%
jan 1, 1964
3.683
+0.092
2.55%
jan 1, 1965
4.554
+0.87
23.63%
jan 1, 1966
4.435
-0.119
-2.61%
jan 1, 1967
4.189
-0.245
-5.53%
jan 1, 1968
4.005
-0.185
-4.41%
jan 1, 1969
4.344
+0.339
8.46%
jan 1, 1970
4.591
+0.247
5.7%
jan 1, 1971
4.406
-0.186
-4.04%
jan 1, 1972
5.252
+0.846
19.2%
jan 1, 1973
5.018
-0.233
-4.44%
jan 1, 1974
4.813
-0.205
-4.09%
jan 1, 1975
4.274
-0.54
-11.21%
jan 1, 1976
4.508
+0.235
5.49%
jan 1, 1977
4.317
-0.191
-4.23%
jan 1, 1978
4.326
+0.008
0.19%
jan 1, 1979
4.405
+0.08
1.84%
jan 1, 1980
4.058
-0.348
-7.89%
jan 1, 1981
4.272
+0.215
5.29%
jan 1, 1982
4.722
+0.45
10.52%
jan 1, 1983
4.647
-0.075
-1.58%
jan 1, 1984
4.255
-0.392
-8.43%
jan 1, 1985
4.198
-0.058
-1.35%
jan 1, 1986
4.085
-0.113
-2.7%
jan 1, 1987
4.238
+0.154
3.76%
jan 1, 1988
4.537
+0.299
7.05%
jan 1, 1989
4.548
+0.011
0.24%
jan 1, 1990
5.036
+0.488
10.72%
jan 1, 1991
5.101
+0.066
1.3%
jan 1, 1992
5.354
+0.253
4.96%
jan 1, 1993
5.74
+0.386
7.2%
jan 1, 1994
6.39
+0.65
11.33%
jan 1, 1995
6.617
+0.227
3.55%
jan 1, 1996
7.231
+0.615
9.29%
jan 1, 1997
7.038
-0.194
-2.68%
jan 1, 1998
7.124
+0.086
1.23%
jan 1, 1999
6.961
-0.163
-2.29%
jan 1, 2000
6.644
-0.317
-4.56%
jan 1, 2001
6.853
+0.209
3.14%
jan 1, 2002
7.483
+0.63
9.19%
jan 1, 2003
7.929
+0.446
5.96%
jan 1, 2004
8.148
+0.22
2.77%
jan 1, 2005
8.572
+0.424
5.2%
jan 1, 2006
8.472
-0.1
-1.17%
jan 1, 2007
8.462
-0.009
-0.11%
jan 1, 2008
8.978
+0.516
6.1%
jan 1, 2009
9.197
+0.219
2.43%
jan 1, 2010
9.982
+0.785
8.54%
jan 1, 2011
10.327
+0.345
3.46%
jan 1, 2012
10.19
-0.137
-1.33%
jan 1, 2013
10.852
+0.662
6.49%
jan 1, 2014
11.769
+0.917
8.45%
jan 1, 2015
11.984
+0.215
1.83%
Ranking of countries by current statistics by years


Comments: