29
/
en
AIzaSyAYiBZKx7MnpbEhh9jyipgxe19OcubqV5w
April 1, 2024
186786
Malawi
MWI
true
2
1
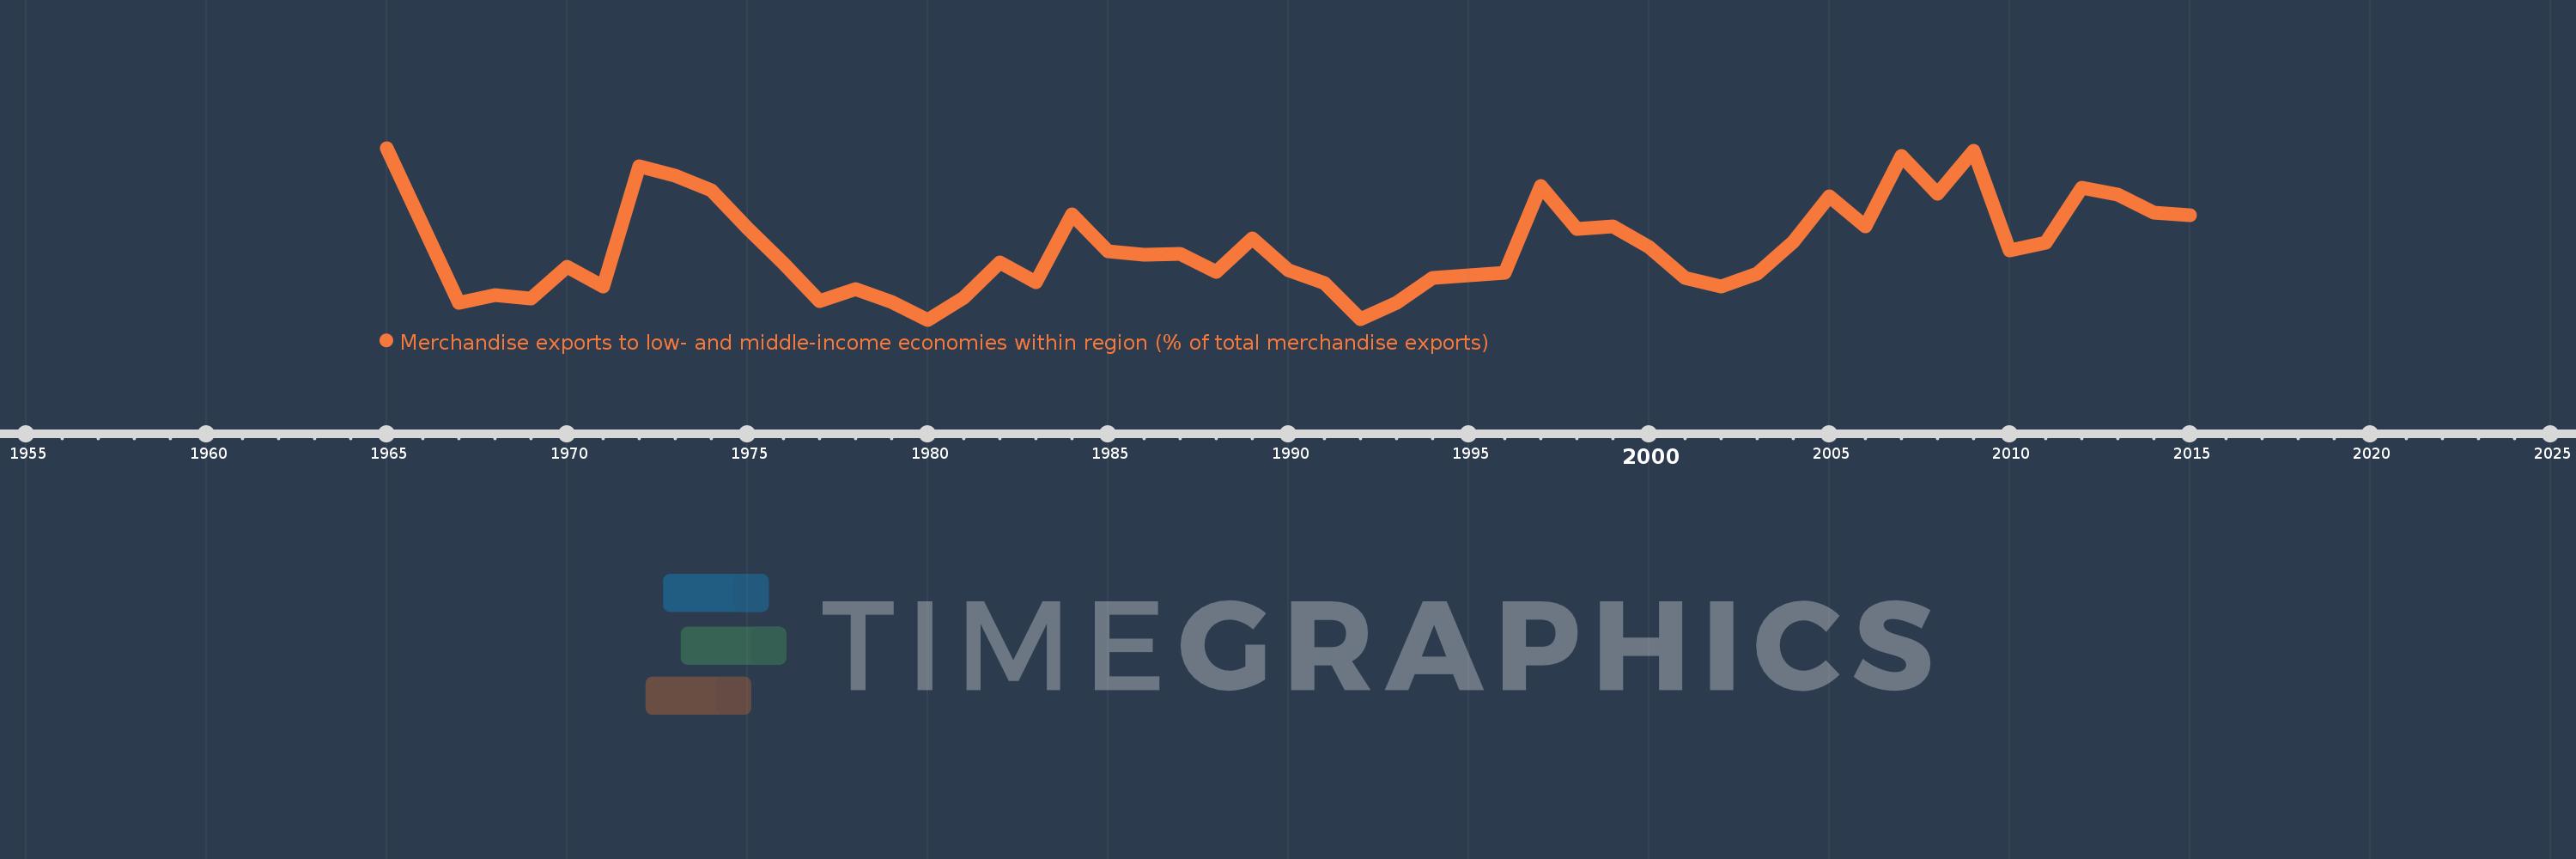
Merchandise exports to low- and middle-income economies within region (% of total merchandise exports)
2015,2014,2013,2012,2011,2010,2009,2008,2007,2006,2005,2004,2003,2002,2001,2000,1999,1998,1997,1996,1995,1994,1993,1992,1991,1990,1989,1988,1987,1986,1985,1984,1983,1982,1981,1980,1979,1978,1977,1976,1975,1974,1973,1972,1971,1970,1969,1968,1967,1965
This statistics in other country:
Timeline:
This timeline shows a graph from 1965 to 2015 of Malawi. No data until 1964. Number of actual observations by date: 50.
Source name:
World Development Indicators
Source organization:
World Bank staff estimates based data from International Monetary Fund's Direction of Trade database.
Categories, topics:
Private Sector, Trade
Last updated:
apr 23, 2017
Indicators value changes by year
Minimum:
10.578
jan 1, 1980
Maximum:
31.302
jan 1, 1965
At the date of observation
Value
Absolute change
Change from previous value
jan 1, 1965
31.302
+31.302
0.0%
jan 1, 1967
12.629
-18.673
-59.65%
jan 1, 1968
13.54
+0.911
7.21%
jan 1, 1969
13.158
-0.382
-2.82%
jan 1, 1970
17.0
+3.842
29.2%
jan 1, 1971
14.551
-2.448
-14.4%
jan 1, 1972
29.07
+14.519
99.78%
jan 1, 1973
27.932
-1.138
-3.91%
jan 1, 1974
26.185
-1.746
-6.25%
jan 1, 1975
21.635
-4.55
-17.38%
jan 1, 1976
17.414
-4.221
-19.51%
jan 1, 1977
12.832
-4.582
-26.31%
jan 1, 1978
14.315
+1.483
11.56%
jan 1, 1979
12.714
-1.602
-11.19%
jan 1, 1980
10.578
-2.136
-16.8%
jan 1, 1981
13.255
+2.678
25.32%
jan 1, 1982
17.462
+4.207
31.74%
jan 1, 1983
15.105
-2.357
-13.5%
jan 1, 1984
23.317
+8.211
54.36%
jan 1, 1985
18.795
-4.522
-19.39%
jan 1, 1986
18.454
-0.341
-1.82%
jan 1, 1987
18.508
+0.055
0.3%
jan 1, 1988
16.309
-2.199
-11.88%
jan 1, 1989
20.435
+4.126
25.3%
jan 1, 1990
16.518
-3.917
-19.17%
jan 1, 1991
14.952
-1.566
-9.48%
jan 1, 1992
10.647
-4.304
-28.79%
jan 1, 1993
12.58
+1.933
18.15%
jan 1, 1994
15.611
+3.03
24.09%
jan 1, 1995
15.95
+0.34
2.18%
jan 1, 1996
16.284
+0.333
2.09%
jan 1, 1997
26.745
+10.461
64.24%
jan 1, 1998
21.521
-5.224
-19.53%
jan 1, 1999
21.821
+0.3
1.4%
jan 1, 2000
19.381
-2.441
-11.18%
jan 1, 2001
15.641
-3.739
-19.29%
jan 1, 2002
14.553
-1.088
-6.96%
jan 1, 2003
16.169
+1.616
11.11%
jan 1, 2004
20.02
+3.851
23.82%
jan 1, 2005
25.466
+5.446
27.2%
jan 1, 2006
21.841
-3.625
-14.23%
jan 1, 2007
30.324
+8.483
38.84%
jan 1, 2008
25.782
-4.542
-14.98%
jan 1, 2009
30.951
+5.169
20.05%
jan 1, 2010
18.964
-11.987
-38.73%
jan 1, 2011
19.902
+0.938
4.94%
jan 1, 2012
26.458
+6.556
32.94%
jan 1, 2013
25.7
-0.758
-2.86%
jan 1, 2014
23.544
-2.156
-8.39%
jan 1, 2015
23.168
-0.376
-1.6%
Ranking of countries by current statistics by years


Comments: