29
/
en
AIzaSyAYiBZKx7MnpbEhh9jyipgxe19OcubqV5w
April 1, 2024
54985
Post-demographic dividend
PST
false
2
1
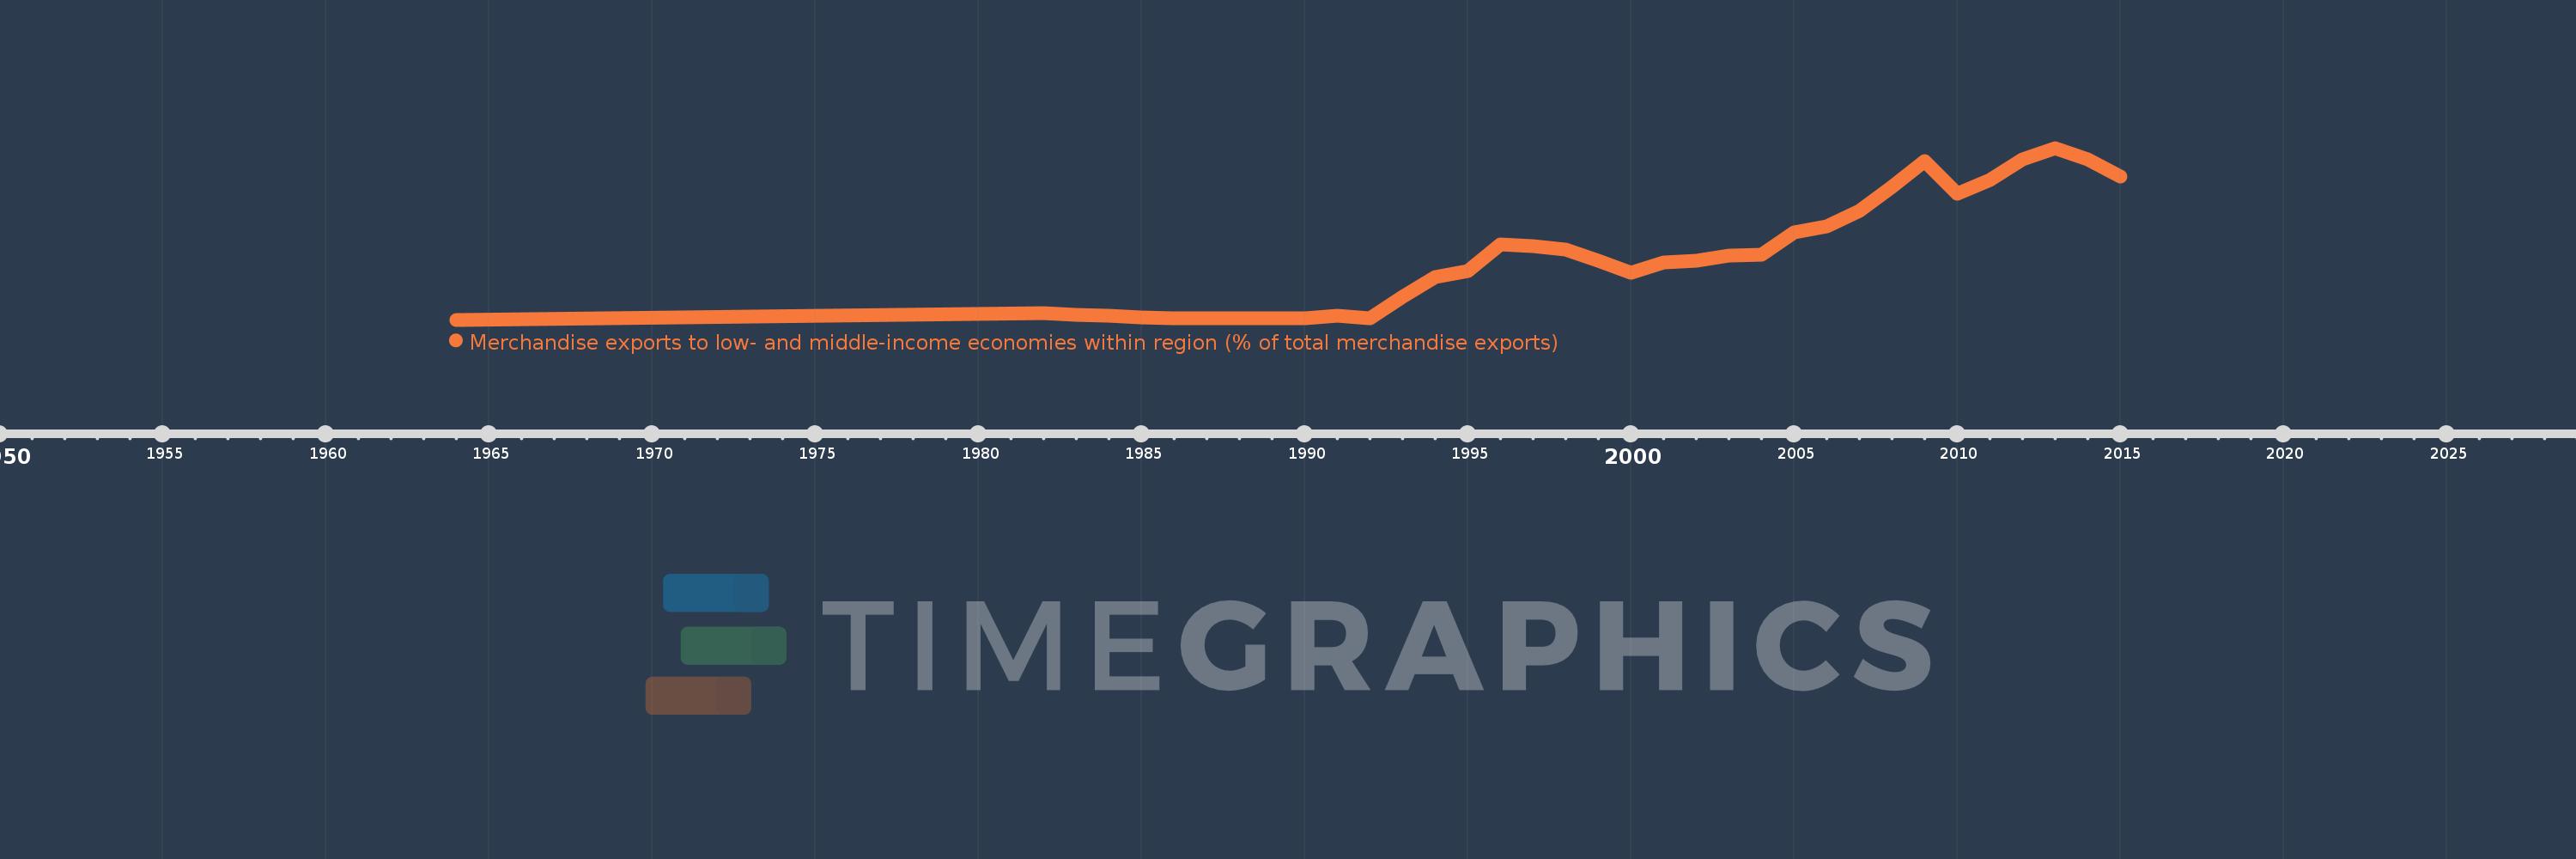
Merchandise exports to low- and middle-income economies within region (% of total merchandise exports)
2015,2014,2013,2012,2011,2010,2009,2008,2007,2006,2005,2004,2003,2002,2001,2000,1999,1998,1997,1996,1995,1994,1993,1992,1991,1990,1989,1988,1987,1986,1985,1984,1983,1982,1964
This statistics in other country:
Timeline:
This timeline shows a graph from 1964 to 2015 of Post-demographic dividend. No data until 1963. Number of actual observations by date: 35.
Source name:
World Development Indicators
Source organization:
World Bank staff estimates based data from International Monetary Fund's Direction of Trade database.
Categories, topics:
Private Sector, Trade
Last updated:
apr 23, 2017
Indicators value changes by year
At the date of observation
Value
Absolute change
Change from previous value
jan 1, 1982
0.011
+0.011
%
jan 1, 1983
0.008
-0.003
-26.49%
jan 1, 1984
0.006
-0.002
-31.15%
jan 1, 1985
0.004
-0.001
-22.89%
jan 1, 1986
0.003
-0.001
-32.41%
jan 1, 1987
0.003
+0.0
14.67%
jan 1, 1988
0.003
-0.001
-16.47%
jan 1, 1989
0.002
-0.001
-40.18%
jan 1, 1990
0.003
+0.002
96.87%
jan 1, 1991
0.006
+0.003
94.86%
jan 1, 1992
0.003
-0.003
-50.74%
jan 1, 1993
0.038
+0.035
1.12K%
jan 1, 1994
0.069
+0.031
82.4%
jan 1, 1995
0.079
+0.01
14.42%
jan 1, 1996
0.123
+0.044
55.4%
jan 1, 1997
0.12
-0.003
-2.46%
jan 1, 1998
0.114
-0.005
-4.54%
jan 1, 1999
0.096
-0.018
-15.9%
jan 1, 2000
0.076
-0.021
-21.45%
jan 1, 2001
0.093
+0.017
22.39%
jan 1, 2002
0.096
+0.004
3.78%
jan 1, 2003
0.104
+0.008
8.17%
jan 1, 2004
0.106
+0.003
2.42%
jan 1, 2005
0.142
+0.036
33.87%
jan 1, 2006
0.152
+0.009
6.43%
jan 1, 2007
0.178
+0.027
17.66%
jan 1, 2008
0.216
+0.038
21.36%
jan 1, 2009
0.259
+0.043
19.82%
jan 1, 2010
0.205
-0.054
-20.81%
jan 1, 2011
0.228
+0.022
10.8%
jan 1, 2012
0.262
+0.035
15.3%
jan 1, 2013
0.28
+0.018
6.84%
jan 1, 2014
0.261
-0.02
-7.04%
jan 1, 2015
0.233
-0.027
-10.49%
Ranking of countries by current statistics by years


Comments: