29
/
en
AIzaSyAYiBZKx7MnpbEhh9jyipgxe19OcubqV5w
April 1, 2024
32821
Europe & Central Asia (IDA & IBRD countries)
TEC
false
2
1
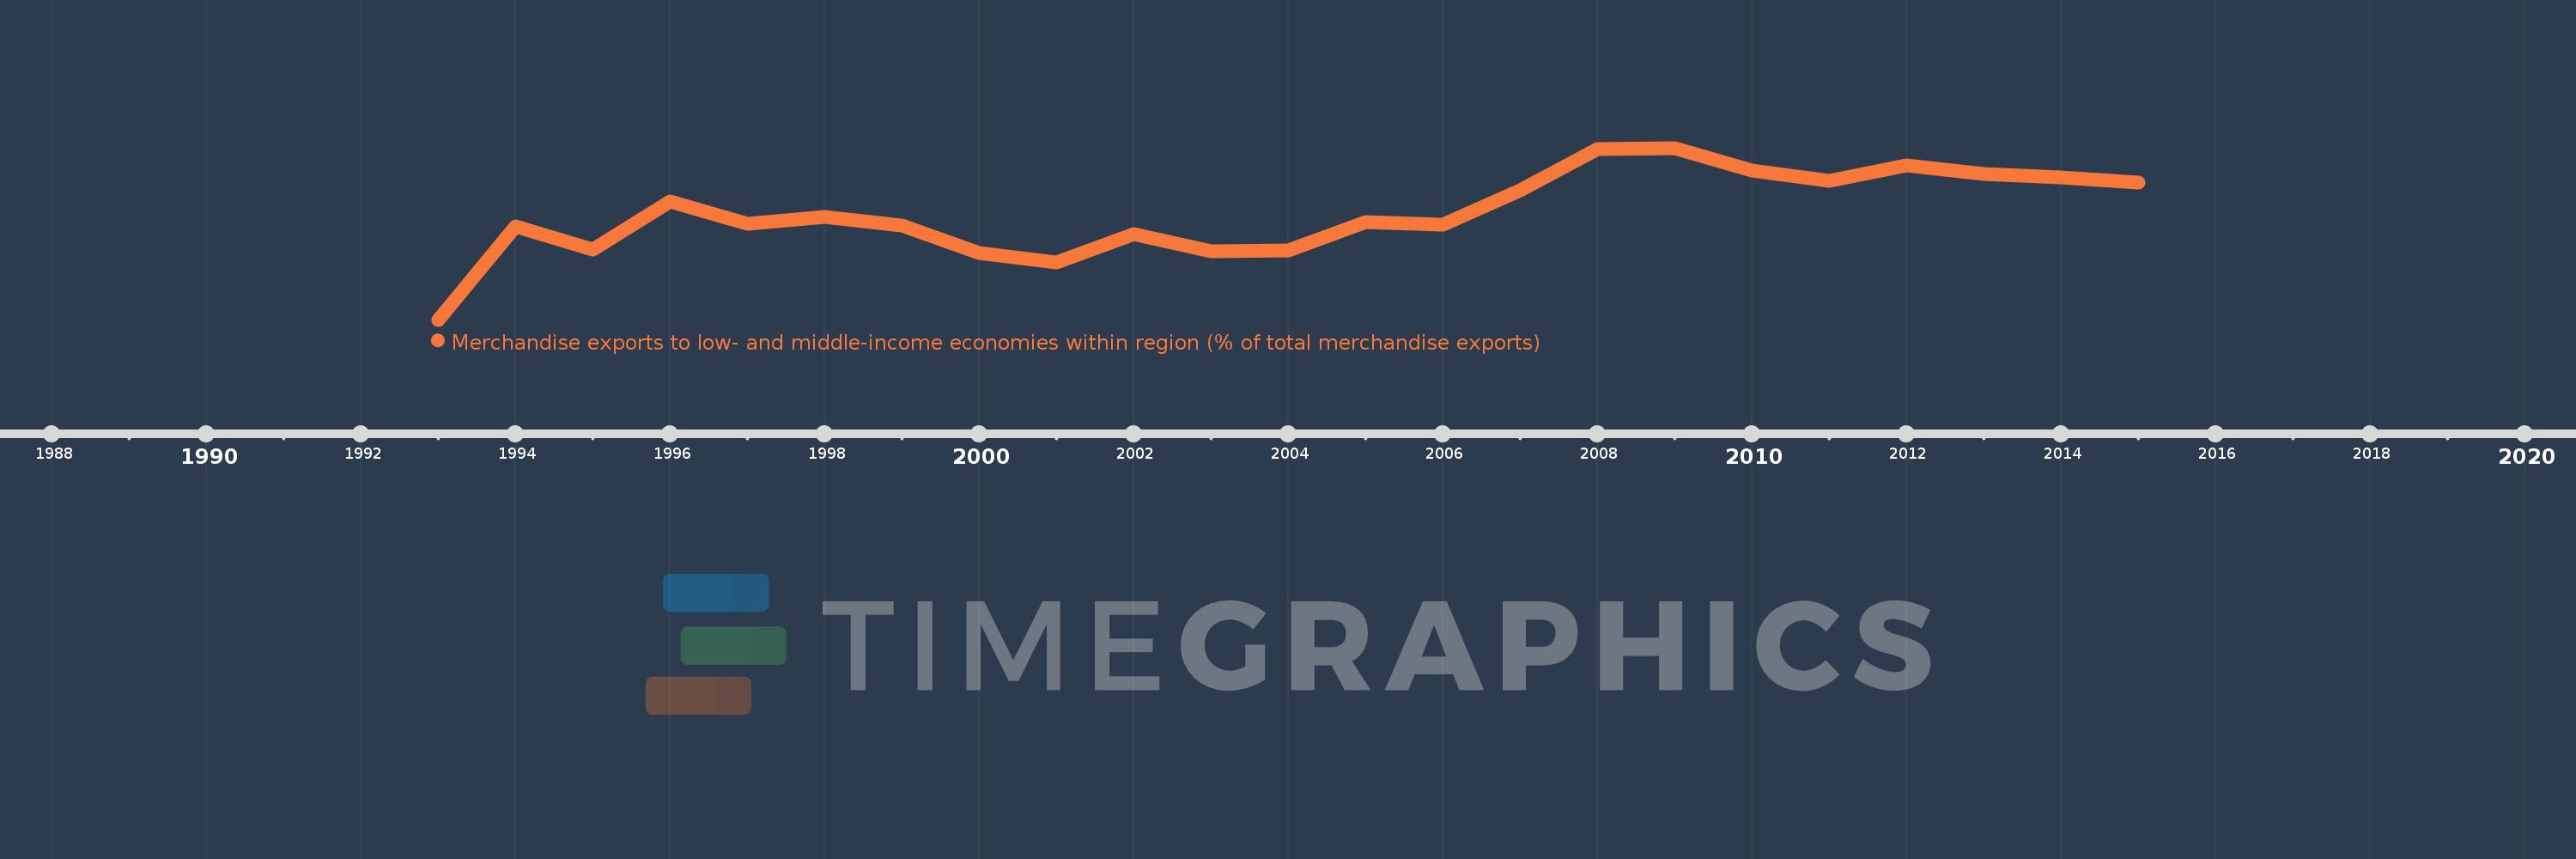
Merchandise exports to low- and middle-income economies within region (% of total merchandise exports)
2015,2014,2013,2012,2011,2010,2009,2008,2007,2006,2005,2004,2003,2002,2001,2000,1999,1998,1997,1996,1995,1994,1993
This statistics in other country:
Timeline:
This timeline shows a graph from 1993 to 2015 of Europe & Central Asia (IDA & IBRD countries). No data until 1992. Number of actual observations by date: 23.
Source name:
World Development Indicators
Source organization:
World Bank staff estimates based data from International Monetary Fund's Direction of Trade database.
Categories, topics:
Private Sector, Trade
Last updated:
apr 23, 2017
Indicators value changes by year
At the date of observation
Value
Absolute change
Change from previous value
jan 1, 1993
3.054
+3.054
0.0%
jan 1, 1994
5.207
+2.153
70.5%
jan 1, 1995
4.663
-0.544
-10.45%
jan 1, 1996
5.769
+1.106
23.71%
jan 1, 1997
5.268
-0.501
-8.68%
jan 1, 1998
5.413
+0.145
2.76%
jan 1, 1999
5.227
-0.187
-3.45%
jan 1, 2000
4.594
-0.633
-12.12%
jan 1, 2001
4.367
-0.227
-4.93%
jan 1, 2002
5.02
+0.654
14.97%
jan 1, 2003
4.629
-0.391
-7.79%
jan 1, 2004
4.643
+0.014
0.29%
jan 1, 2005
5.307
+0.665
14.31%
jan 1, 2006
5.242
-0.066
-1.24%
jan 1, 2007
6.041
+0.799
15.24%
jan 1, 2008
6.975
+0.934
15.47%
jan 1, 2009
7.006
+0.031
0.44%
jan 1, 2010
6.478
-0.528
-7.54%
jan 1, 2011
6.259
-0.219
-3.38%
jan 1, 2012
6.61
+0.352
5.62%
jan 1, 2013
6.415
-0.196
-2.96%
jan 1, 2014
6.32
-0.094
-1.47%
jan 1, 2015
6.202
-0.119
-1.88%
Ranking of countries by current statistics by years


Comments: