29
/
en
AIzaSyAYiBZKx7MnpbEhh9jyipgxe19OcubqV5w
April 1, 2024
123785
Ecuador
ECU
true
2
1
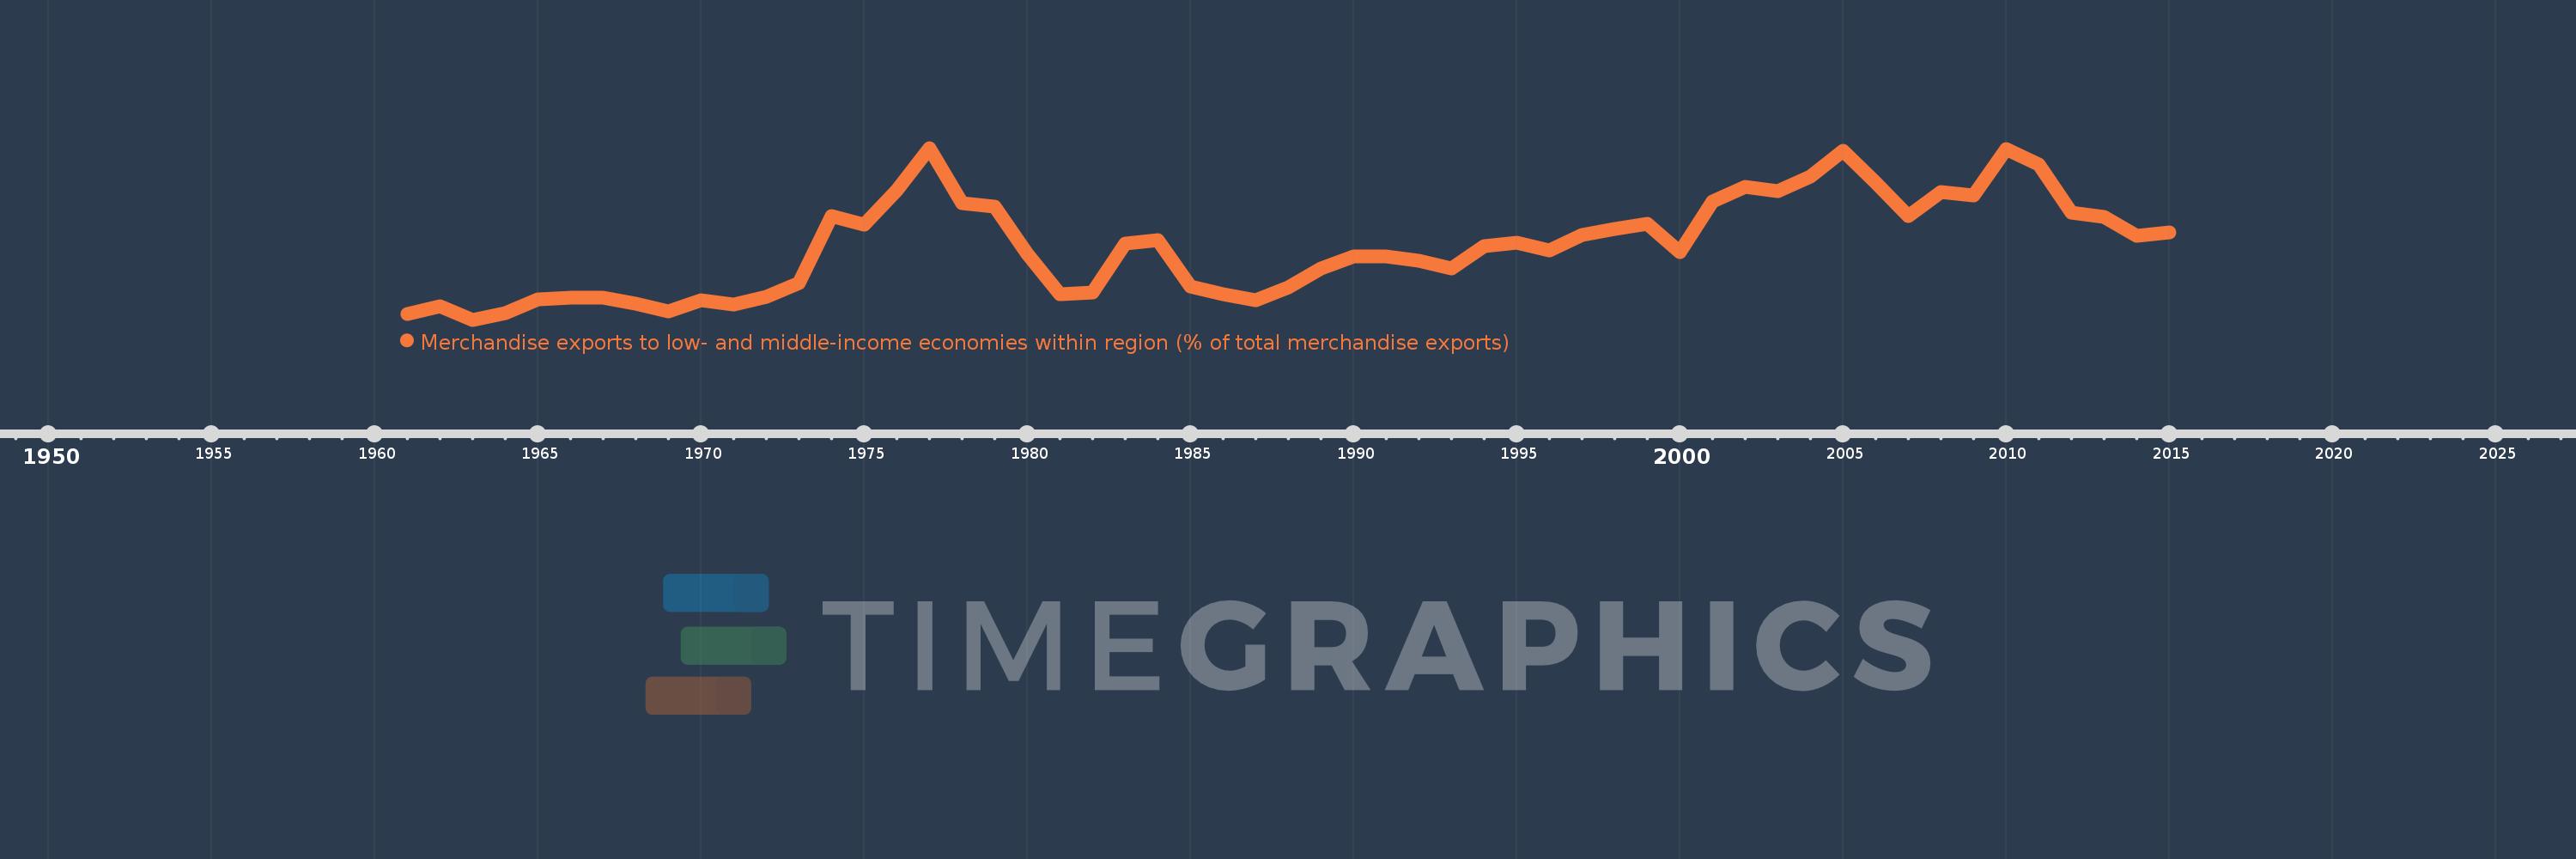
Merchandise exports to low- and middle-income economies within region (% of total merchandise exports)
2015,2014,2013,2012,2011,2010,2009,2008,2007,2006,2005,2004,2003,2002,2001,2000,1999,1998,1997,1996,1995,1994,1993,1992,1991,1990,1989,1988,1987,1986,1985,1984,1983,1982,1981,1980,1979,1978,1977,1976,1975,1974,1973,1972,1971,1970,1969,1968,1967,1966,1965,1964,1963,1962,1961
This statistics in other country:
Timeline:
This timeline shows a graph from 1961 to 2015 of Ecuador. No data until 1960. Number of actual observations by date: 55.
Source name:
World Development Indicators
Source organization:
World Bank staff estimates based data from International Monetary Fund's Direction of Trade database.
Categories, topics:
Private Sector, Trade
Last updated:
apr 23, 2017
Indicators value changes by year
Maximum:
31.192
jan 1, 1977
At the date of observation
Value
Absolute change
Change from previous value
jan 1, 1961
4.073
+4.073
0.0%
jan 1, 1962
5.389
+1.316
32.3%
jan 1, 1963
3.168
-2.221
-41.21%
jan 1, 1964
4.237
+1.069
33.76%
jan 1, 1965
6.476
+2.239
52.85%
jan 1, 1966
6.827
+0.351
5.42%
jan 1, 1967
6.778
-0.049
-0.72%
jan 1, 1968
5.756
-1.022
-15.07%
jan 1, 1969
4.519
-1.238
-21.5%
jan 1, 1970
6.383
+1.864
41.25%
jan 1, 1971
5.621
-0.762
-11.94%
jan 1, 1972
6.975
+1.355
24.1%
jan 1, 1973
9.115
+2.14
30.68%
jan 1, 1974
20.041
+10.926
119.86%
jan 1, 1975
18.642
-1.4
-6.98%
jan 1, 1976
24.24
+5.598
30.03%
jan 1, 1977
31.192
+6.952
28.68%
jan 1, 1978
22.204
-8.987
-28.81%
jan 1, 1979
21.608
-0.597
-2.69%
jan 1, 1980
13.882
-7.726
-35.75%
jan 1, 1981
7.371
-6.511
-46.9%
jan 1, 1982
7.663
+0.292
3.96%
jan 1, 1983
15.569
+7.906
103.17%
jan 1, 1984
16.1
+0.531
3.41%
jan 1, 1985
8.571
-7.529
-46.77%
jan 1, 1986
7.358
-1.213
-14.15%
jan 1, 1987
6.392
-0.966
-13.13%
jan 1, 1988
8.42
+2.028
31.73%
jan 1, 1989
11.485
+3.065
36.4%
jan 1, 1990
13.507
+2.022
17.6%
jan 1, 1991
13.512
+0.005
0.04%
jan 1, 1992
12.839
-0.673
-4.98%
jan 1, 1993
11.556
-1.283
-9.99%
jan 1, 1994
15.141
+3.585
31.02%
jan 1, 1995
15.674
+0.533
3.52%
jan 1, 1996
14.432
-1.242
-7.92%
jan 1, 1997
16.944
+2.512
17.41%
jan 1, 1998
17.916
+0.972
5.74%
jan 1, 1999
18.855
+0.938
5.24%
jan 1, 2000
14.256
-4.599
-24.39%
jan 1, 2001
22.445
+8.189
57.45%
jan 1, 2002
24.824
+2.379
10.6%
jan 1, 2003
24.195
-0.63
-2.54%
jan 1, 2004
26.477
+2.282
9.43%
jan 1, 2005
30.676
+4.199
15.86%
jan 1, 2006
25.592
-5.084
-16.57%
jan 1, 2007
20.111
-5.48
-21.41%
jan 1, 2008
23.995
+3.884
19.31%
jan 1, 2009
23.48
-0.516
-2.15%
jan 1, 2010
30.976
+7.496
31.93%
jan 1, 2011
28.514
-2.462
-7.95%
jan 1, 2012
20.649
-7.865
-27.58%
jan 1, 2013
19.928
-0.722
-3.49%
jan 1, 2014
16.8
-3.128
-15.7%
jan 1, 2015
17.485
+0.686
4.08%
Ranking of countries by current statistics by years


Comments: