29
/
en
AIzaSyAYiBZKx7MnpbEhh9jyipgxe19OcubqV5w
April 1, 2024
278986
Uzbekistan
UZB
true
2
1
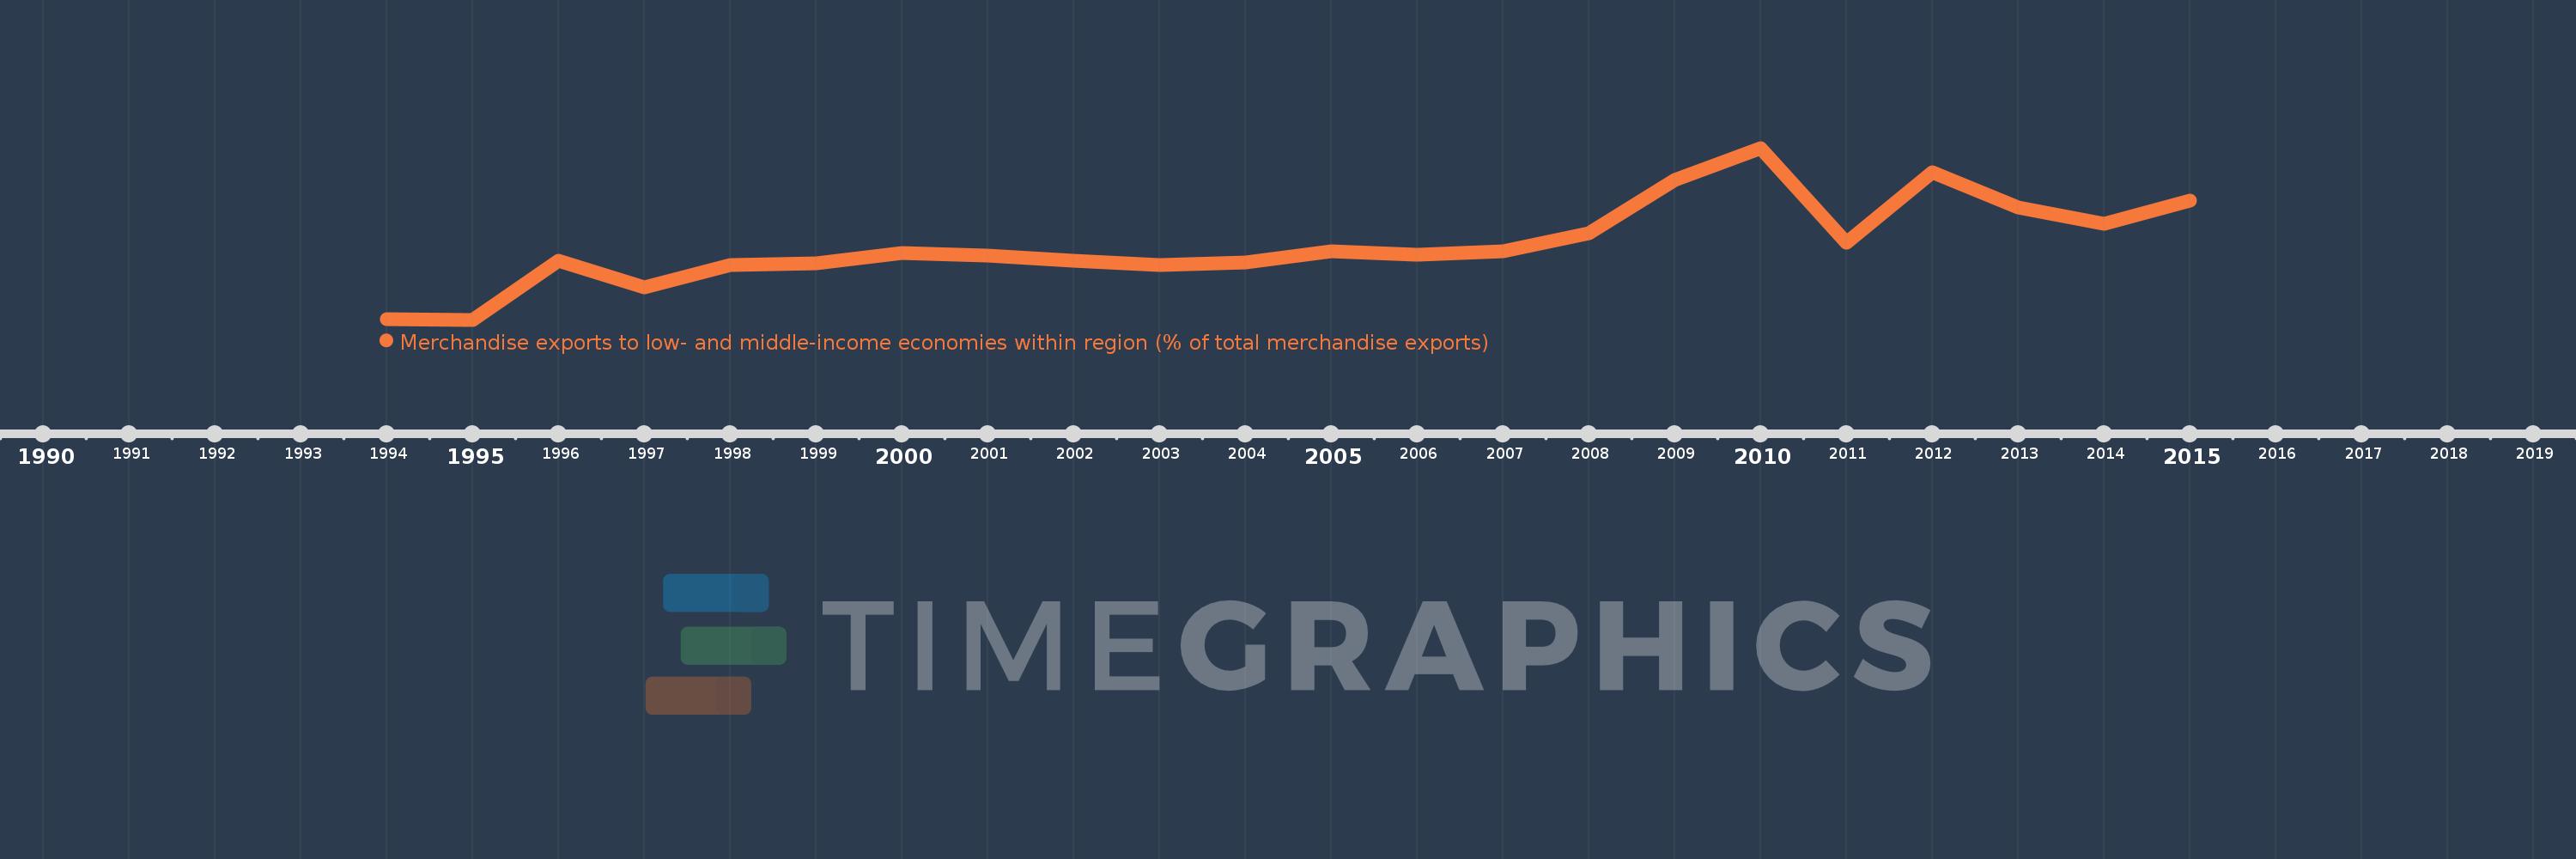
Merchandise exports to low- and middle-income economies within region (% of total merchandise exports)
2015,2014,2013,2012,2011,2010,2009,2008,2007,2006,2005,2004,2003,2002,2001,2000,1999,1998,1997,1996,1995,1994
This statistics in other country:
Timeline:
This timeline shows a graph from 1994 to 2015 of Uzbekistan. No data until 1993. Number of actual observations by date: 22.
Source name:
World Development Indicators
Source organization:
World Bank staff estimates based data from International Monetary Fund's Direction of Trade database.
Categories, topics:
Private Sector, Trade
Last updated:
apr 23, 2017
Indicators value changes by year
Minimum:
13.742
jan 1, 1995
At the date of observation
Value
Absolute change
Change from previous value
jan 1, 1994
13.967
+13.967
0.0%
jan 1, 1995
13.742
-0.224
-1.61%
jan 1, 1996
27.36
+13.618
99.1%
jan 1, 1997
21.263
-6.097
-22.28%
jan 1, 1998
26.25
+4.987
23.45%
jan 1, 1999
26.795
+0.545
2.07%
jan 1, 2000
29.206
+2.411
9.0%
jan 1, 2001
28.444
-0.762
-2.61%
jan 1, 2002
27.232
-1.212
-4.26%
jan 1, 2003
26.264
-0.968
-3.55%
jan 1, 2004
26.929
+0.665
2.53%
jan 1, 2005
29.529
+2.6
9.66%
jan 1, 2006
28.651
-0.878
-2.97%
jan 1, 2007
29.511
+0.86
3.0%
jan 1, 2008
33.614
+4.102
13.9%
jan 1, 2009
45.824
+12.21
36.32%
jan 1, 2010
53.3
+7.476
16.31%
jan 1, 2011
31.504
-21.796
-40.89%
jan 1, 2012
47.692
+16.188
51.38%
jan 1, 2013
39.669
-8.023
-16.82%
jan 1, 2014
35.907
-3.762
-9.48%
jan 1, 2015
41.121
+5.213
14.52%
Ranking of countries by current statistics by years


Comments: