29
/
en
AIzaSyAYiBZKx7MnpbEhh9jyipgxe19OcubqV5w
April 1, 2024
252125
St. Vincent and the Grenadines
VCT
true
2
1
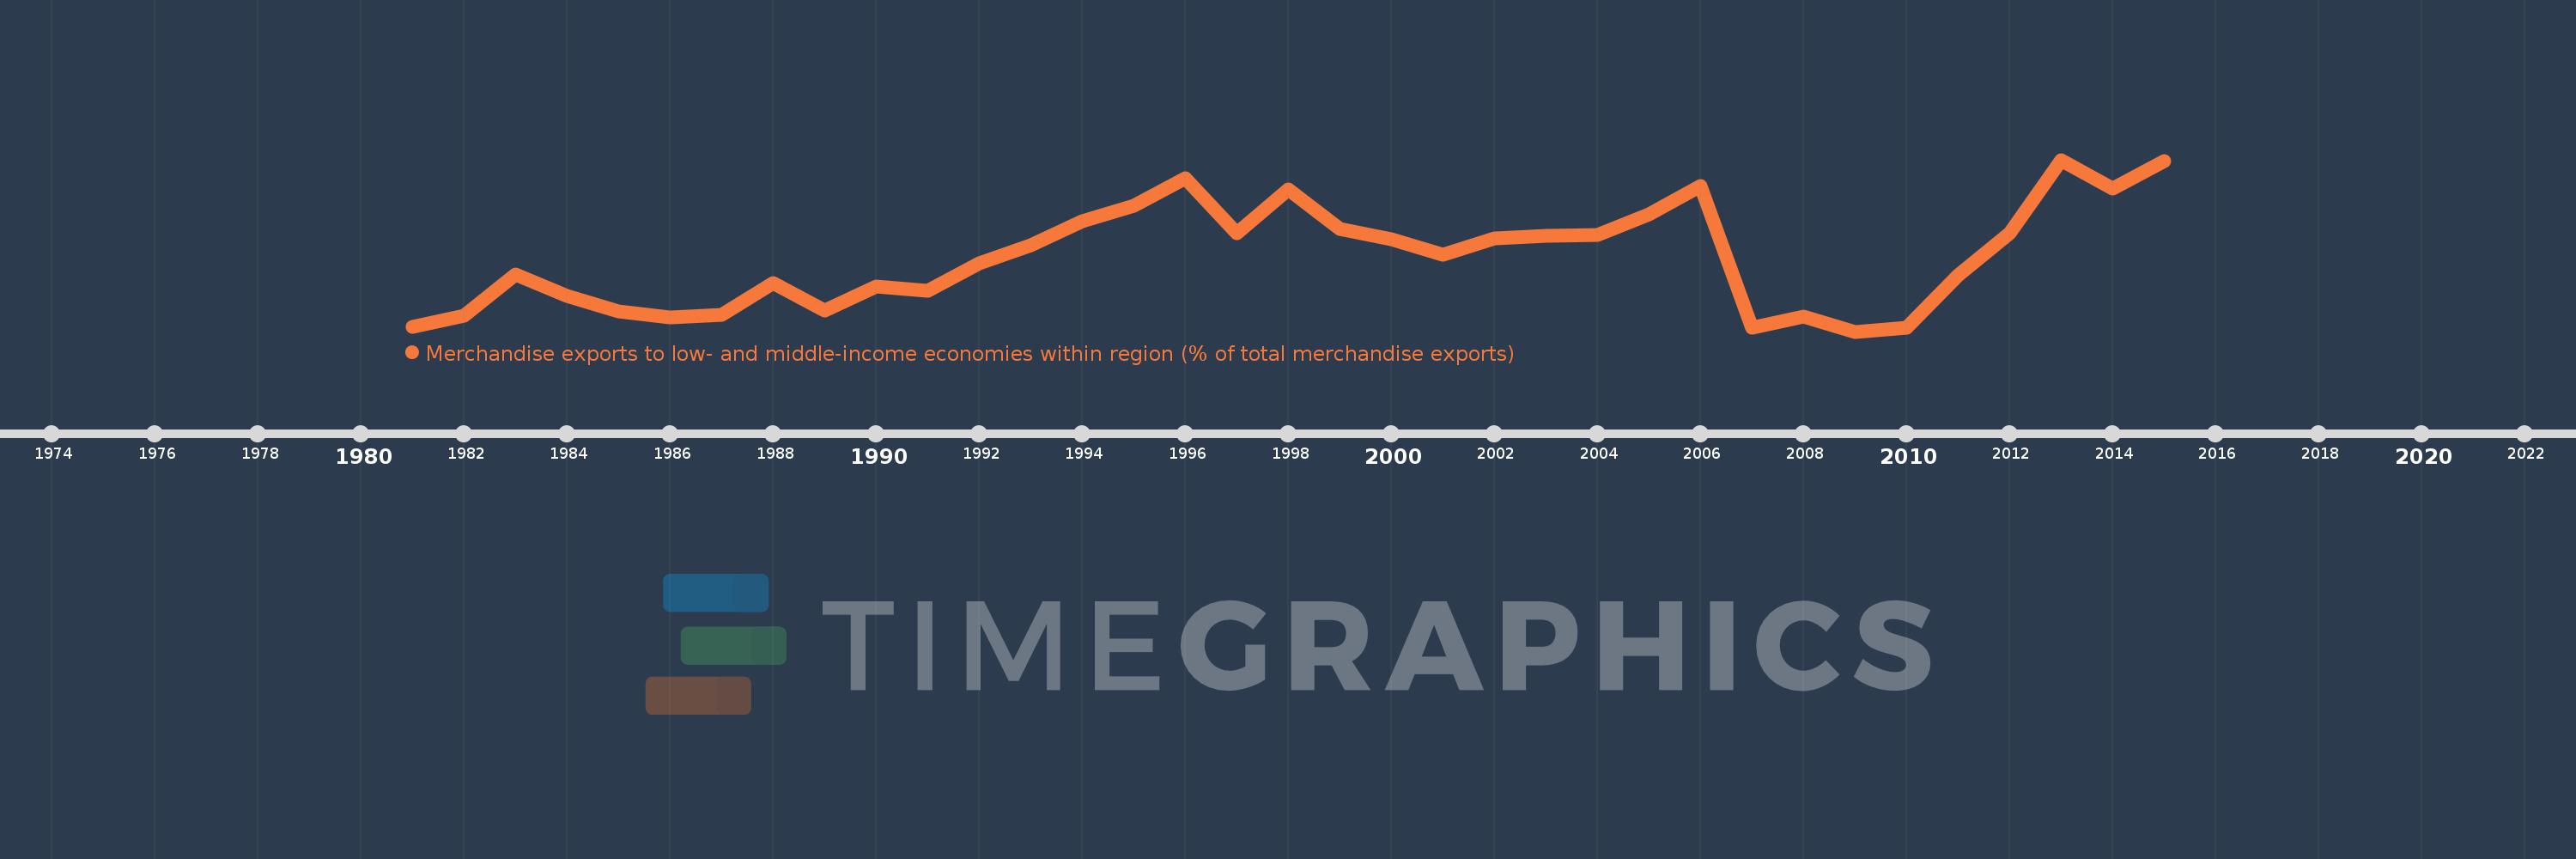
Merchandise exports to low- and middle-income economies within region (% of total merchandise exports)
2015,2014,2013,2012,2011,2010,2009,2008,2007,2006,2005,2004,2003,2002,2001,2000,1999,1998,1997,1996,1995,1994,1993,1992,1991,1990,1989,1988,1987,1986,1985,1984,1983,1982,1981
This statistics in other country:
Timeline:
This timeline shows a graph from 1981 to 2015 of St. Vincent and the Grenadines. No data until 1980. Number of actual observations by date: 35.
Source name:
World Development Indicators
Source organization:
World Bank staff estimates based data from International Monetary Fund's Direction of Trade database.
Categories, topics:
Private Sector, Trade
Last updated:
apr 23, 2017
Indicators value changes by year
Maximum:
31.432
jan 1, 2013
At the date of observation
Value
Absolute change
Change from previous value
jan 1, 1981
7.085
+7.085
0.0%
jan 1, 1982
8.716
+1.631
23.01%
jan 1, 1983
14.779
+6.063
69.56%
jan 1, 1984
11.569
-3.21
-21.72%
jan 1, 1985
9.405
-2.164
-18.71%
jan 1, 1986
8.503
-0.902
-9.6%
jan 1, 1987
8.89
+0.388
4.56%
jan 1, 1988
13.489
+4.598
51.72%
jan 1, 1989
9.461
-4.028
-29.86%
jan 1, 1990
13.014
+3.553
37.56%
jan 1, 1991
12.413
-0.601
-4.62%
jan 1, 1992
16.391
+3.977
32.04%
jan 1, 1993
18.96
+2.57
15.68%
jan 1, 1994
22.548
+3.588
18.93%
jan 1, 1995
24.807
+2.258
10.02%
jan 1, 1996
28.803
+3.996
16.11%
jan 1, 1997
20.694
-8.109
-28.15%
jan 1, 1998
27.169
+6.475
31.29%
jan 1, 1999
21.401
-5.768
-21.23%
jan 1, 2000
19.858
-1.543
-7.21%
jan 1, 2001
17.583
-2.275
-11.46%
jan 1, 2002
20.009
+2.425
13.79%
jan 1, 2003
20.383
+0.375
1.87%
jan 1, 2004
20.471
+0.088
0.43%
jan 1, 2005
23.484
+3.013
14.72%
jan 1, 2006
27.567
+4.083
17.39%
jan 1, 2007
6.981
-20.586
-74.68%
jan 1, 2008
8.574
+1.592
22.81%
jan 1, 2009
6.434
-2.139
-24.95%
jan 1, 2010
6.983
+0.548
8.52%
jan 1, 2011
14.665
+7.682
110.02%
jan 1, 2012
20.769
+6.105
41.63%
jan 1, 2013
31.432
+10.663
51.34%
jan 1, 2014
27.217
-4.216
-13.41%
jan 1, 2015
31.24
+4.024
14.78%
Ranking of countries by current statistics by years


Comments: