29
/
en
AIzaSyAYiBZKx7MnpbEhh9jyipgxe19OcubqV5w
April 1, 2024
138313
Georgia
GEO
true
2
1
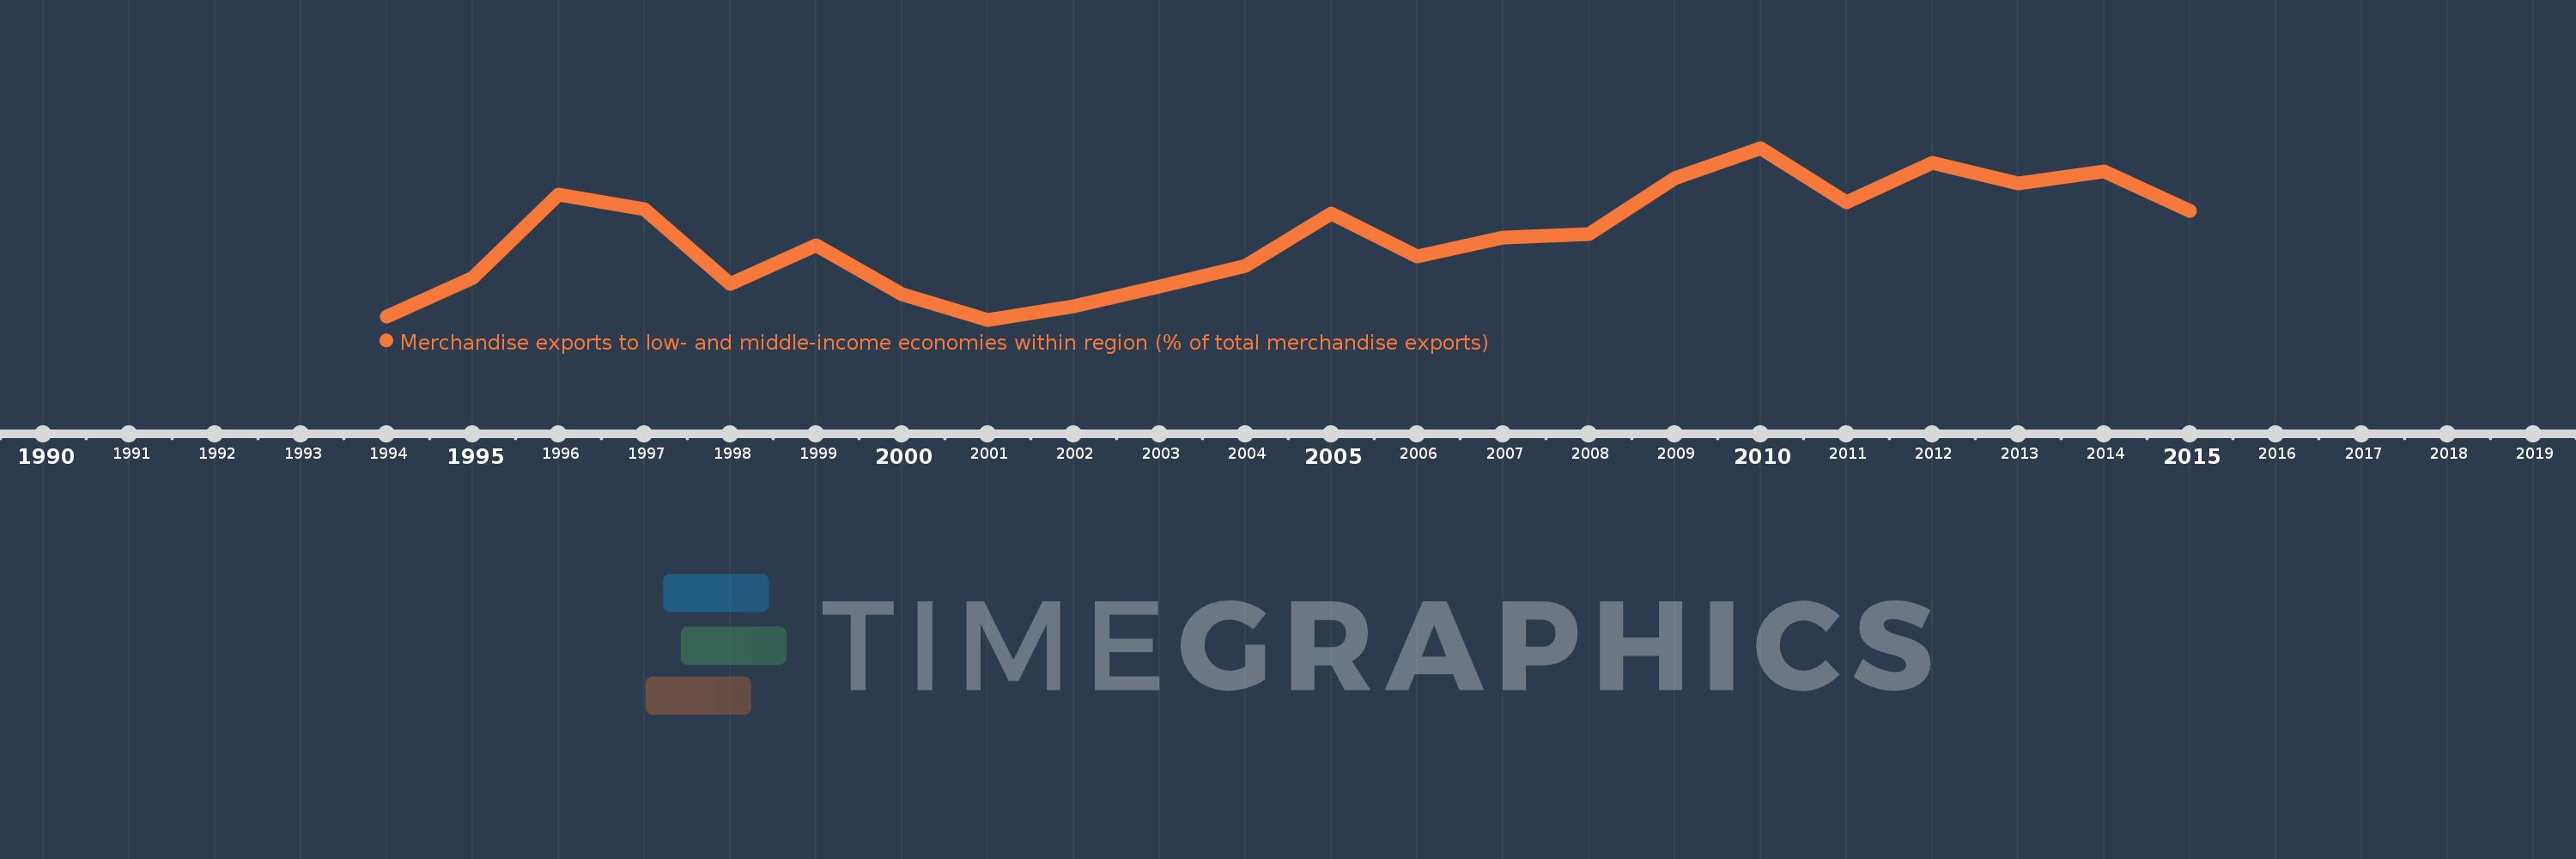
Merchandise exports to low- and middle-income economies within region (% of total merchandise exports)
2015,2014,2013,2012,2011,2010,2009,2008,2007,2006,2005,2004,2003,2002,2001,2000,1999,1998,1997,1996,1995,1994
This statistics in other country:
Timeline:
This timeline shows a graph from 1994 to 2015 of Georgia. No data until 1993. Number of actual observations by date: 22.
Source name:
World Development Indicators
Source organization:
World Bank staff estimates based data from International Monetary Fund's Direction of Trade database.
Categories, topics:
Private Sector, Trade
Last updated:
apr 23, 2017
Indicators value changes by year
Minimum:
42.344
jan 1, 2001
Maximum:
63.835
jan 1, 2010
At the date of observation
Value
Absolute change
Change from previous value
jan 1, 1994
42.778
+42.778
0.0%
jan 1, 1995
47.595
+4.817
11.26%
jan 1, 1996
58.003
+10.407
21.87%
jan 1, 1997
56.176
-1.827
-3.15%
jan 1, 1998
46.825
-9.35
-16.64%
jan 1, 1999
51.659
+4.834
10.32%
jan 1, 2000
45.513
-6.147
-11.9%
jan 1, 2001
42.344
-3.168
-6.96%
jan 1, 2002
44.027
+1.683
3.97%
jan 1, 2003
46.451
+2.424
5.51%
jan 1, 2004
49.09
+2.638
5.68%
jan 1, 2005
55.661
+6.571
13.39%
jan 1, 2006
50.232
-5.429
-9.75%
jan 1, 2007
52.623
+2.39
4.76%
jan 1, 2008
53.077
+0.454
0.86%
jan 1, 2009
60.009
+6.932
13.06%
jan 1, 2010
63.835
+3.826
6.38%
jan 1, 2011
57.002
-6.834
-10.71%
jan 1, 2012
62.014
+5.012
8.79%
jan 1, 2013
59.394
-2.62
-4.22%
jan 1, 2014
60.852
+1.458
2.46%
jan 1, 2015
55.987
-4.865
-7.99%
Ranking of countries by current statistics by years


Comments: