29
/
en
AIzaSyAYiBZKx7MnpbEhh9jyipgxe19OcubqV5w
April 1, 2024
61824
Upper middle income
UMC
false
2
1
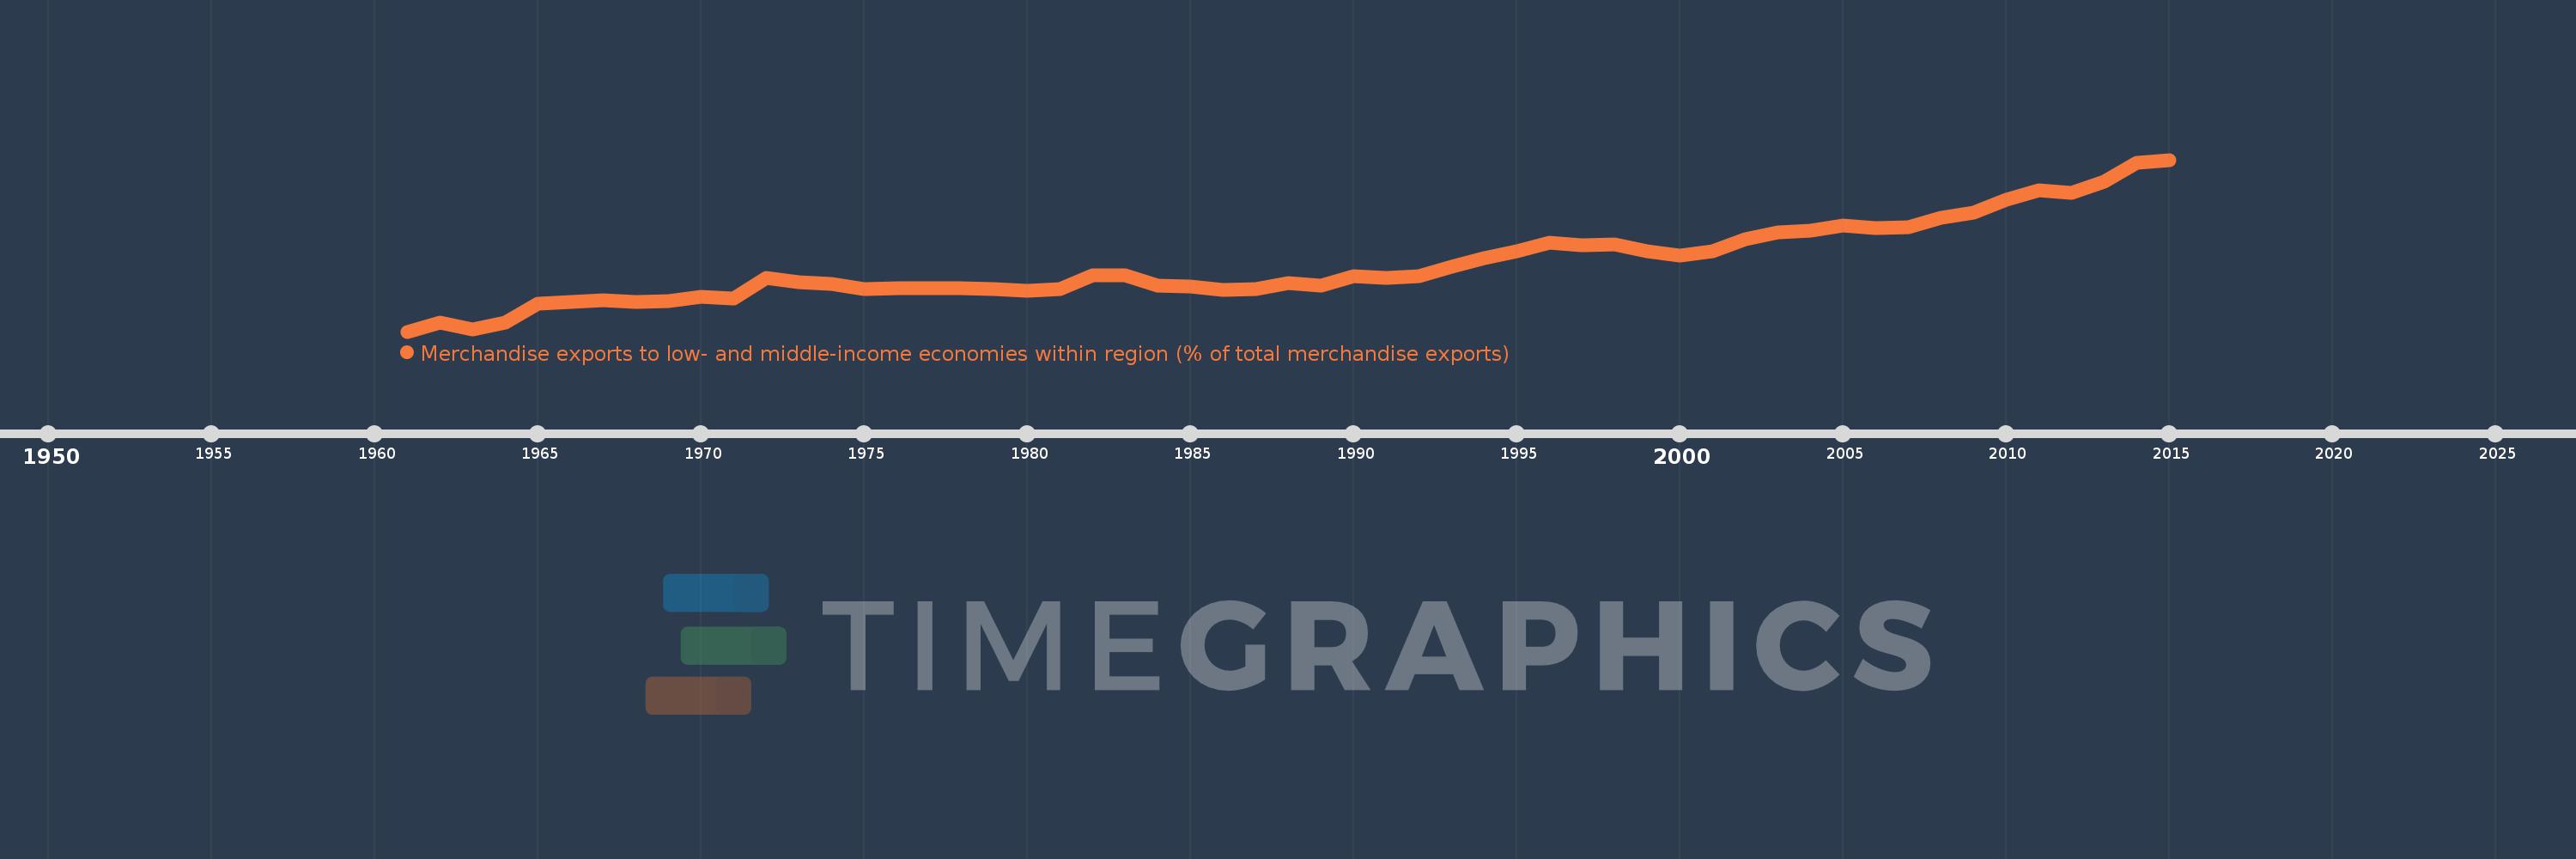
Merchandise exports to low- and middle-income economies within region (% of total merchandise exports)
2015,2014,2013,2012,2011,2010,2009,2008,2007,2006,2005,2004,2003,2002,2001,2000,1999,1998,1997,1996,1995,1994,1993,1992,1991,1990,1989,1988,1987,1986,1985,1984,1983,1982,1981,1980,1979,1978,1977,1976,1975,1974,1973,1972,1971,1970,1969,1968,1967,1966,1965,1964,1963,1962,1961
This statistics in other country:
Timeline:
This timeline shows a graph from 1961 to 2015 of Upper middle income. No data until 1960. Number of actual observations by date: 55.
Source name:
World Development Indicators
Source organization:
World Bank staff estimates based data from International Monetary Fund's Direction of Trade database.
Categories, topics:
Private Sector, Trade
Last updated:
apr 23, 2017
Indicators value changes by year
Maximum:
10.794
jan 1, 2015
At the date of observation
Value
Absolute change
Change from previous value
jan 1, 1961
1.581
+1.581
0.0%
jan 1, 1962
2.071
+0.49
30.96%
jan 1, 1963
1.682
-0.389
-18.77%
jan 1, 1964
2.047
+0.365
21.69%
jan 1, 1965
3.078
+1.031
50.36%
jan 1, 1966
3.168
+0.089
2.9%
jan 1, 1967
3.273
+0.106
3.33%
jan 1, 1968
3.162
-0.111
-3.39%
jan 1, 1969
3.201
+0.039
1.22%
jan 1, 1970
3.443
+0.242
7.57%
jan 1, 1971
3.37
-0.074
-2.14%
jan 1, 1972
4.467
+1.098
32.57%
jan 1, 1973
4.211
-0.256
-5.73%
jan 1, 1974
4.149
-0.063
-1.49%
jan 1, 1975
3.875
-0.274
-6.61%
jan 1, 1976
3.885
+0.011
0.28%
jan 1, 1977
3.91
+0.025
0.64%
jan 1, 1978
3.909
-0.001
-0.02%
jan 1, 1979
3.865
-0.045
-1.14%
jan 1, 1980
3.748
-0.117
-3.01%
jan 1, 1981
3.881
+0.133
3.54%
jan 1, 1982
4.612
+0.731
18.85%
jan 1, 1983
4.611
-0.001
-0.01%
jan 1, 1984
4.041
-0.571
-12.38%
jan 1, 1985
3.981
-0.06
-1.47%
jan 1, 1986
3.797
-0.184
-4.62%
jan 1, 1987
3.862
+0.064
1.69%
jan 1, 1988
4.182
+0.321
8.31%
jan 1, 1989
4.051
-0.131
-3.13%
jan 1, 1990
4.555
+0.503
12.42%
jan 1, 1991
4.452
-0.102
-2.24%
jan 1, 1992
4.54
+0.087
1.96%
jan 1, 1993
5.045
+0.506
11.14%
jan 1, 1994
5.522
+0.477
9.45%
jan 1, 1995
5.879
+0.357
6.46%
jan 1, 1996
6.362
+0.483
8.22%
jan 1, 1997
6.193
-0.169
-2.66%
jan 1, 1998
6.245
+0.052
0.84%
jan 1, 1999
5.885
-0.359
-5.76%
jan 1, 2000
5.638
-0.247
-4.2%
jan 1, 2001
5.869
+0.23
4.08%
jan 1, 2002
6.537
+0.669
11.39%
jan 1, 2003
6.89
+0.353
5.39%
jan 1, 2004
6.99
+0.1
1.45%
jan 1, 2005
7.266
+0.276
3.95%
jan 1, 2006
7.14
-0.126
-1.73%
jan 1, 2007
7.164
+0.024
0.34%
jan 1, 2008
7.707
+0.543
7.57%
jan 1, 2009
7.939
+0.232
3.01%
jan 1, 2010
8.665
+0.725
9.14%
jan 1, 2011
9.149
+0.484
5.59%
jan 1, 2012
9.004
-0.144
-1.58%
jan 1, 2013
9.626
+0.622
6.9%
jan 1, 2014
10.644
+1.018
10.58%
jan 1, 2015
10.794
+0.15
1.41%
Ranking of countries by current statistics by years


Comments: