29
/
en
AIzaSyAYiBZKx7MnpbEhh9jyipgxe19OcubqV5w
April 1, 2024
77094
Bahrain
BHR
true
2
1
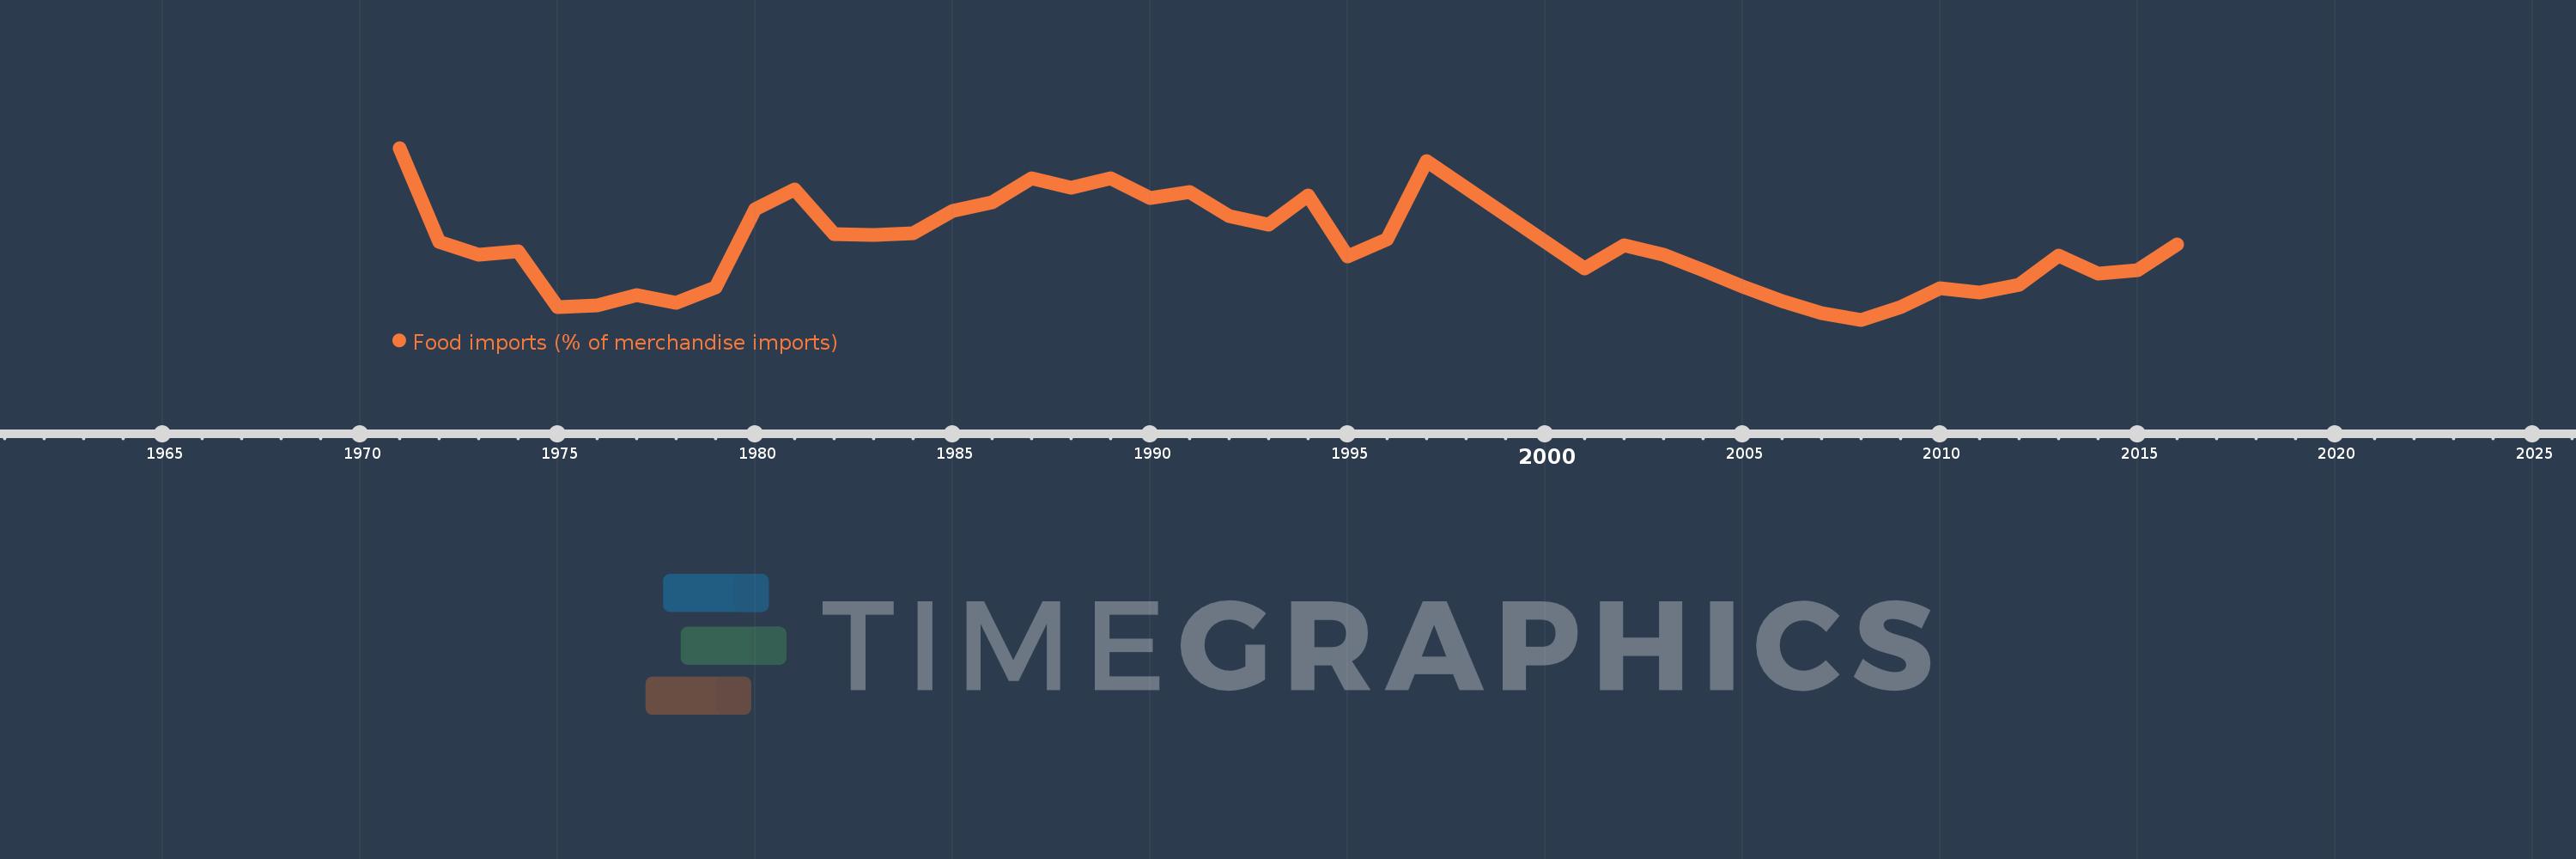
Food imports (% of merchandise imports)
2016,2015,2014,2013,2012,2011,2010,2009,2008,2007,2006,2005,2004,2003,2002,2001,1997,1996,1995,1994,1993,1992,1991,1990,1989,1988,1987,1986,1985,1984,1983,1982,1981,1980,1979,1978,1977,1976,1975,1974,1973,1972,1971
This statistics in other country:
AfghanistanAlbaniaAlgeriaAndorraAngolaAntigua and BarbudaArab WorldArgentinaArmeniaArubaAustraliaAustriaAzerbaijanBahamas, TheBahrainBangladeshBarbadosBelarusBelgiumBelizeBeninBermudaBhutanBoliviaBosnia and HerzegovinaBotswanaBrazilBrunei DarussalamBulgariaBurkina FasoBurundiCabo VerdeCambodiaCameroonCanadaCaribbean small statesCayman IslandsCentral African RepublicCentral Europe and the BalticsChadChileChinaColombiaComorosCongo, Dem. Rep.Congo, Rep.Costa RicaCote d'IvoireCroatiaCubaCyprusCzech RepublicDenmarkDjiboutiDominicaDominican RepublicEarly-demographic dividendEast Asia & PacificEast Asia & Pacific (excluding high income)East Asia & Pacific (IDA & IBRD countries)EcuadorEgypt, Arab Rep.El SalvadorEquatorial GuineaEritreaEstoniaEthiopiaEuro areaEurope & Central AsiaEurope & Central Asia (excluding high income)Europe & Central Asia (IDA & IBRD countries)European UnionFaroe IslandsFijiFinlandFragile and conflict affected situationsFranceFrench PolynesiaGabonGambia, TheGeorgiaGermanyGhanaGreeceGreenlandGrenadaGuatemalaGuineaGuinea-BissauGuyanaHaitiHeavily indebted poor countries (HIPC)High incomeHondurasHong Kong SAR, ChinaHungaryIBRD onlyIcelandIDA & IBRD totalIDA blendIDA onlyIDA totalIndiaIndonesiaIran, Islamic Rep.IraqIrelandIsraelItalyJamaicaJapanJordanKazakhstanKenyaKiribatiKorea, Rep.KuwaitKyrgyz RepublicLao PDRLate-demographic dividendLatin America & Caribbean Latin America & Caribbean (excluding high income)Latin America & the Caribbean (IDA & IBRD countries)LatviaLeast developed countries: UN classificationLebanonLesothoLiberiaLibyaLithuaniaLow & middle incomeLow incomeLower middle incomeLuxembourgMacao SAR, ChinaMacedonia, FYRMadagascarMalawiMalaysiaMaldivesMaliMaltaMauritaniaMauritiusMexicoMiddle East & North AfricaMiddle East & North Africa (excluding high income)Middle East & North Africa (IDA & IBRD countries)Middle incomeMoldovaMongoliaMoroccoMozambiqueMyanmarNamibiaNepalNetherlandsNew CaledoniaNew ZealandNicaraguaNigerNigeriaNorth AmericaNorwayOECD membersOmanOther small statesPacific island small statesPakistanPalauPanamaPapua New GuineaParaguayPeruPhilippinesPolandPortugalPost-demographic dividendPre-demographic dividendQatarRomaniaRussian FederationRwandaSamoaSao Tome and PrincipeSaudi ArabiaSenegalSerbiaSeychellesSierra LeoneSingaporeSlovak RepublicSloveniaSmall statesSolomon IslandsSomaliaSouth AfricaSouth AsiaSouth Asia (IDA & IBRD)SpainSri LankaSt. Kitts and NevisSt. LuciaSt. Vincent and the GrenadinesSub-Saharan Africa Sub-Saharan Africa (excluding high income)Sub-Saharan Africa (IDA & IBRD countries)SudanSurinameSwazilandSwedenSwitzerlandSyrian Arab RepublicTajikistanTanzaniaThailandTimor-LesteTogoTongaTrinidad and TobagoTunisiaTurkeyTurkmenistanTurks and Caicos IslandsTuvaluUgandaUkraineUnited Arab EmiratesUnited KingdomUnited StatesUpper middle incomeUruguayVanuatuVenezuela, RBVietnamVirgin Islands (U.S.)WorldYemen, Rep.ZambiaZimbabwe Timeline:
This timeline shows a graph from 1971 to 2016 of Bahrain. No data until 1970. Number of actual observations by date: 43.
Source name:
World Development Indicators
Source organization:
World Bank staff estimates from the Comtrade database maintained by the United Nations Statistics Division.
Categories, topics:
Private Sector, Trade
Last updated:
apr 23, 2017
Indicators value changes by year
Maximum:
20.357
jan 1, 1971
At the date of observation
Value
Absolute change
Change from previous value
jan 1, 1971
20.357
+20.357
0.0%
jan 1, 1972
12.034
-8.323
-40.88%
jan 1, 1973
10.935
-1.099
-9.13%
jan 1, 1974
11.221
+0.286
2.61%
jan 1, 1975
6.28
-4.941
-44.04%
jan 1, 1976
6.43
+0.151
2.4%
jan 1, 1977
7.323
+0.893
13.89%
jan 1, 1978
6.681
-0.642
-8.77%
jan 1, 1979
8.059
+1.378
20.62%
jan 1, 1980
14.96
+6.901
85.63%
jan 1, 1981
16.686
+1.726
11.54%
jan 1, 1982
12.751
-3.935
-23.58%
jan 1, 1983
12.667
-0.084
-0.66%
jan 1, 1984
12.811
+0.144
1.14%
jan 1, 1985
14.76
+1.949
15.21%
jan 1, 1986
15.537
+0.777
5.27%
jan 1, 1987
17.67
+2.133
13.73%
jan 1, 1988
16.842
-0.828
-4.69%
jan 1, 1989
17.667
+0.825
4.9%
jan 1, 1990
15.943
-1.724
-9.76%
jan 1, 1991
16.458
+0.515
3.23%
jan 1, 1992
14.304
-2.154
-13.09%
jan 1, 1993
13.555
-0.749
-5.24%
jan 1, 1994
16.187
+2.632
19.42%
jan 1, 1995
10.782
-5.406
-33.39%
jan 1, 1996
12.297
+1.516
14.06%
jan 1, 1997
19.157
+6.86
55.79%
jan 1, 2001
9.699
-9.459
-49.37%
jan 1, 2002
11.741
+2.042
21.05%
jan 1, 2003
10.934
-0.807
-6.87%
jan 1, 2004
9.57
-1.364
-12.47%
jan 1, 2005
8.106
-1.465
-15.3%
jan 1, 2006
6.79
-1.316
-16.24%
jan 1, 2007
5.724
-1.065
-15.69%
jan 1, 2008
5.165
-0.56
-9.77%
jan 1, 2009
6.286
+1.121
21.71%
jan 1, 2010
7.975
+1.689
26.87%
jan 1, 2011
7.57
-0.405
-5.08%
jan 1, 2012
8.274
+0.705
9.31%
jan 1, 2013
10.855
+2.58
31.19%
jan 1, 2014
9.254
-1.601
-14.75%
jan 1, 2015
9.519
+0.266
2.87%
jan 1, 2016
11.821
+2.302
24.18%
Ranking of countries by current statistics by years


Comments: