29
/
en
AIzaSyAYiBZKx7MnpbEhh9jyipgxe19OcubqV5w
April 1, 2024
277650
Uruguay
URY
true
2
1
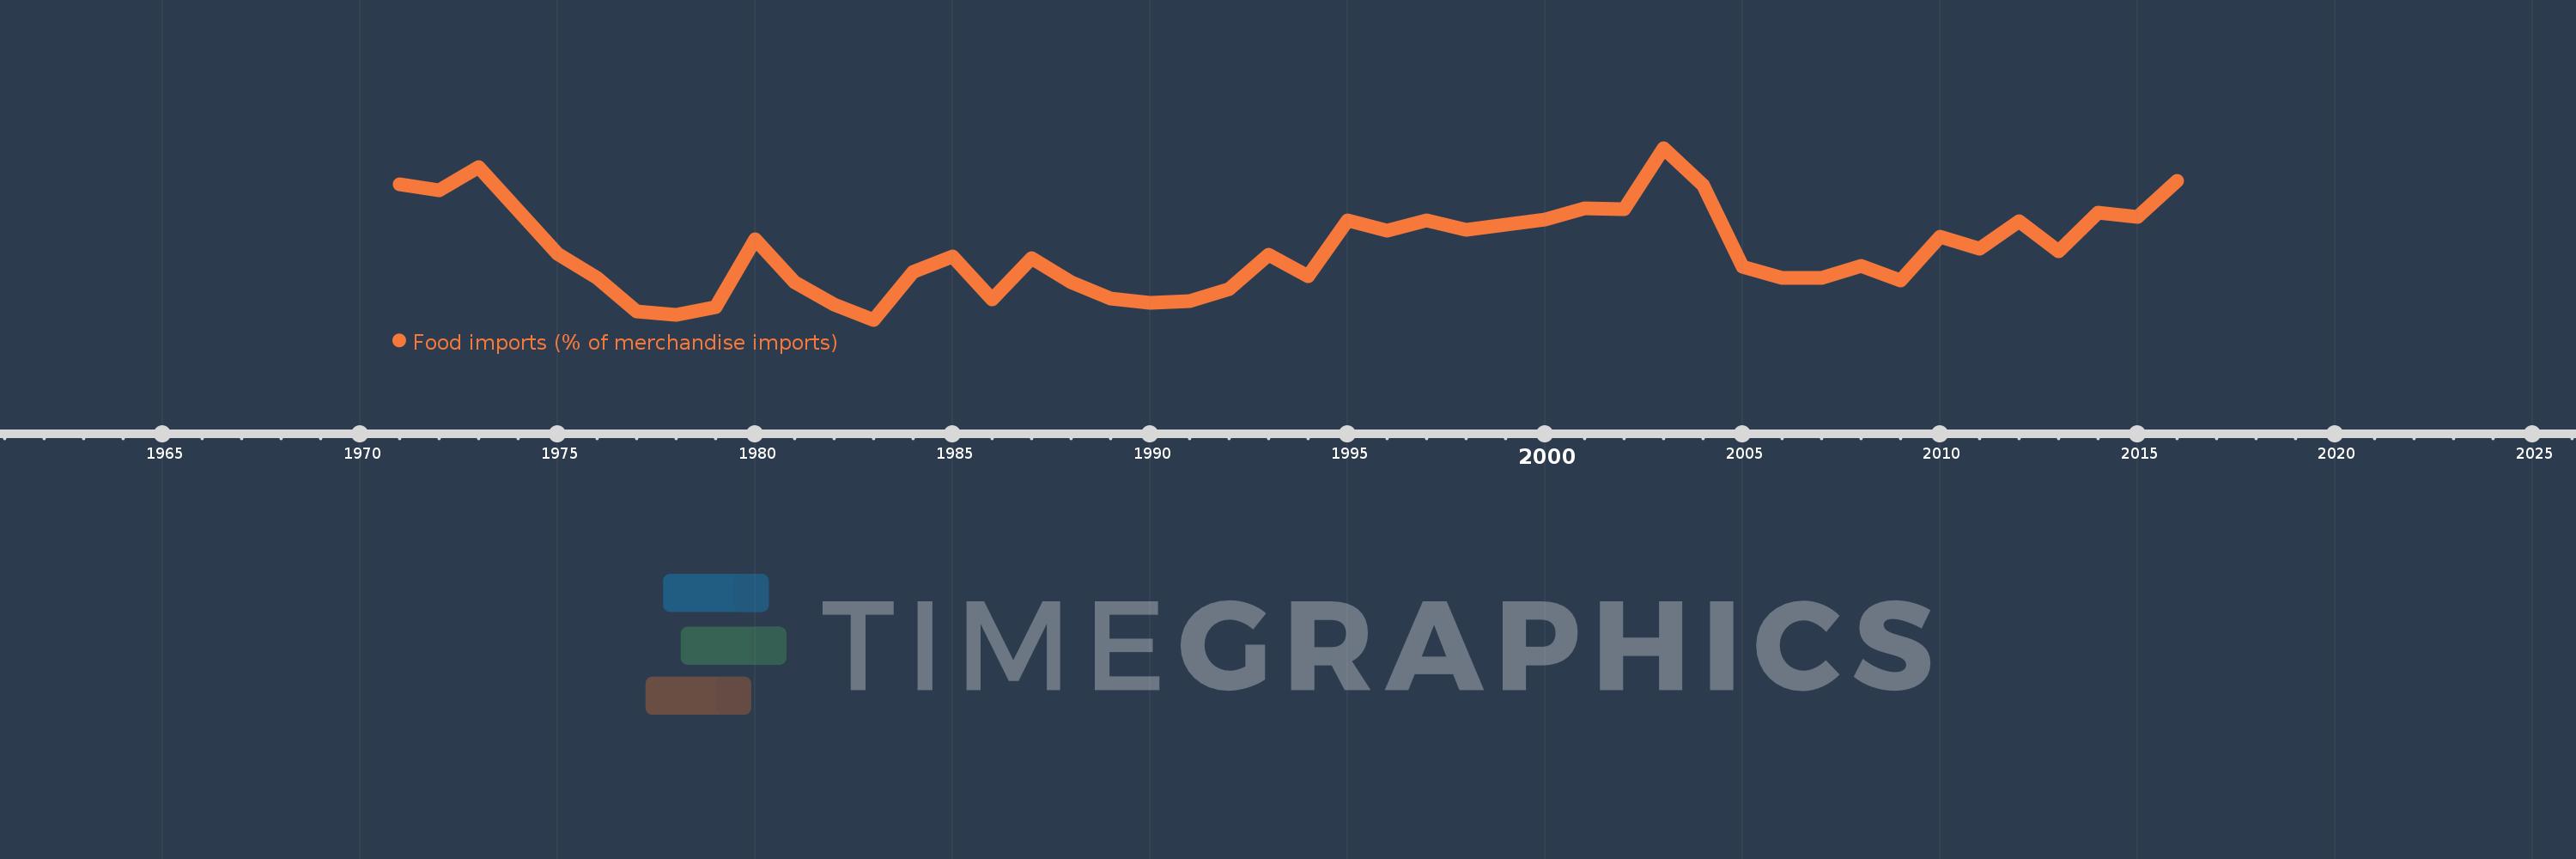
Food imports (% of merchandise imports)
2016,2015,2014,2013,2012,2011,2010,2009,2008,2007,2006,2005,2004,2003,2002,2001,2000,1999,1998,1997,1996,1995,1994,1993,1992,1991,1990,1989,1988,1987,1986,1985,1984,1983,1982,1981,1980,1979,1978,1977,1976,1975,1973,1972,1971
This statistics in other country:
AfghanistanAlbaniaAlgeriaAndorraAngolaAntigua and BarbudaArab WorldArgentinaArmeniaArubaAustraliaAustriaAzerbaijanBahamas, TheBahrainBangladeshBarbadosBelarusBelgiumBelizeBeninBermudaBhutanBoliviaBosnia and HerzegovinaBotswanaBrazilBrunei DarussalamBulgariaBurkina FasoBurundiCabo VerdeCambodiaCameroonCanadaCaribbean small statesCayman IslandsCentral African RepublicCentral Europe and the BalticsChadChileChinaColombiaComorosCongo, Dem. Rep.Congo, Rep.Costa RicaCote d'IvoireCroatiaCubaCyprusCzech RepublicDenmarkDjiboutiDominicaDominican RepublicEarly-demographic dividendEast Asia & PacificEast Asia & Pacific (excluding high income)East Asia & Pacific (IDA & IBRD countries)EcuadorEgypt, Arab Rep.El SalvadorEquatorial GuineaEritreaEstoniaEthiopiaEuro areaEurope & Central AsiaEurope & Central Asia (excluding high income)Europe & Central Asia (IDA & IBRD countries)European UnionFaroe IslandsFijiFinlandFragile and conflict affected situationsFranceFrench PolynesiaGabonGambia, TheGeorgiaGermanyGhanaGreeceGreenlandGrenadaGuatemalaGuineaGuinea-BissauGuyanaHaitiHeavily indebted poor countries (HIPC)High incomeHondurasHong Kong SAR, ChinaHungaryIBRD onlyIcelandIDA & IBRD totalIDA blendIDA onlyIDA totalIndiaIndonesiaIran, Islamic Rep.IraqIrelandIsraelItalyJamaicaJapanJordanKazakhstanKenyaKiribatiKorea, Rep.KuwaitKyrgyz RepublicLao PDRLate-demographic dividendLatin America & Caribbean Latin America & Caribbean (excluding high income)Latin America & the Caribbean (IDA & IBRD countries)LatviaLeast developed countries: UN classificationLebanonLesothoLiberiaLibyaLithuaniaLow & middle incomeLow incomeLower middle incomeLuxembourgMacao SAR, ChinaMacedonia, FYRMadagascarMalawiMalaysiaMaldivesMaliMaltaMauritaniaMauritiusMexicoMiddle East & North AfricaMiddle East & North Africa (excluding high income)Middle East & North Africa (IDA & IBRD countries)Middle incomeMoldovaMongoliaMoroccoMozambiqueMyanmarNamibiaNepalNetherlandsNew CaledoniaNew ZealandNicaraguaNigerNigeriaNorth AmericaNorwayOECD membersOmanOther small statesPacific island small statesPakistanPalauPanamaPapua New GuineaParaguayPeruPhilippinesPolandPortugalPost-demographic dividendPre-demographic dividendQatarRomaniaRussian FederationRwandaSamoaSao Tome and PrincipeSaudi ArabiaSenegalSerbiaSeychellesSierra LeoneSingaporeSlovak RepublicSloveniaSmall statesSolomon IslandsSomaliaSouth AfricaSouth AsiaSouth Asia (IDA & IBRD)SpainSri LankaSt. Kitts and NevisSt. LuciaSt. Vincent and the GrenadinesSub-Saharan Africa Sub-Saharan Africa (excluding high income)Sub-Saharan Africa (IDA & IBRD countries)SudanSurinameSwazilandSwedenSwitzerlandSyrian Arab RepublicTajikistanTanzaniaThailandTimor-LesteTogoTongaTrinidad and TobagoTunisiaTurkeyTurkmenistanTurks and Caicos IslandsTuvaluUgandaUkraineUnited Arab EmiratesUnited KingdomUnited StatesUpper middle incomeUruguayVanuatuVenezuela, RBVietnamVirgin Islands (U.S.)WorldYemen, Rep.ZambiaZimbabwe Timeline:
This timeline shows a graph from 1971 to 2016 of Uruguay. No data until 1970. Number of actual observations by date: 45.
Source name:
World Development Indicators
Source organization:
World Bank staff estimates from the Comtrade database maintained by the United Nations Statistics Division.
Categories, topics:
Private Sector, Trade
Last updated:
apr 23, 2017
Indicators value changes by year
Maximum:
14.472
jan 1, 2003
At the date of observation
Value
Absolute change
Change from previous value
jan 1, 1971
12.68
+12.68
0.0%
jan 1, 1972
12.374
-0.305
-2.41%
jan 1, 1973
13.538
+1.164
9.41%
jan 1, 1975
9.257
-4.282
-31.63%
jan 1, 1976
8.078
-1.179
-12.73%
jan 1, 1977
6.44
-1.638
-20.28%
jan 1, 1978
6.25
-0.19
-2.95%
jan 1, 1979
6.637
+0.388
6.2%
jan 1, 1980
9.995
+3.358
50.59%
jan 1, 1981
7.867
-2.128
-21.29%
jan 1, 1982
6.746
-1.121
-14.25%
jan 1, 1983
6.019
-0.727
-10.77%
jan 1, 1984
8.389
+2.369
39.36%
jan 1, 1985
9.155
+0.767
9.14%
jan 1, 1986
7.002
-2.153
-23.52%
jan 1, 1987
9.034
+2.032
29.01%
jan 1, 1988
7.887
-1.146
-12.69%
jan 1, 1989
7.064
-0.824
-10.44%
jan 1, 1990
6.864
-0.199
-2.82%
jan 1, 1991
6.923
+0.058
0.85%
jan 1, 1992
7.525
+0.602
8.69%
jan 1, 1993
9.211
+1.687
22.42%
jan 1, 1994
8.181
-1.03
-11.19%
jan 1, 1995
10.894
+2.713
33.17%
jan 1, 1996
10.413
-0.481
-4.42%
jan 1, 1997
10.919
+0.506
4.86%
jan 1, 1998
10.455
-0.464
-4.25%
jan 1, 1999
10.679
+0.224
2.14%
jan 1, 2000
10.937
+0.258
2.41%
jan 1, 2001
11.487
+0.551
5.03%
jan 1, 2002
11.438
-0.049
-0.43%
jan 1, 2003
14.472
+3.034
26.53%
jan 1, 2004
12.622
-1.85
-12.78%
jan 1, 2005
8.608
-4.013
-31.8%
jan 1, 2006
8.091
-0.517
-6.01%
jan 1, 2007
8.076
-0.015
-0.18%
jan 1, 2008
8.66
+0.584
7.23%
jan 1, 2009
7.935
-0.725
-8.37%
jan 1, 2010
10.094
+2.159
27.21%
jan 1, 2011
9.51
-0.584
-5.78%
jan 1, 2012
10.876
+1.366
14.36%
jan 1, 2013
9.367
-1.508
-13.87%
jan 1, 2014
11.276
+1.909
20.38%
jan 1, 2015
11.073
-0.204
-1.81%
jan 1, 2016
12.839
+1.766
15.95%
Ranking of countries by current statistics by years


Comments: