29
/
en
AIzaSyAYiBZKx7MnpbEhh9jyipgxe19OcubqV5w
April 1, 2024
266818
Trinidad and Tobago
TTO
true
2
1
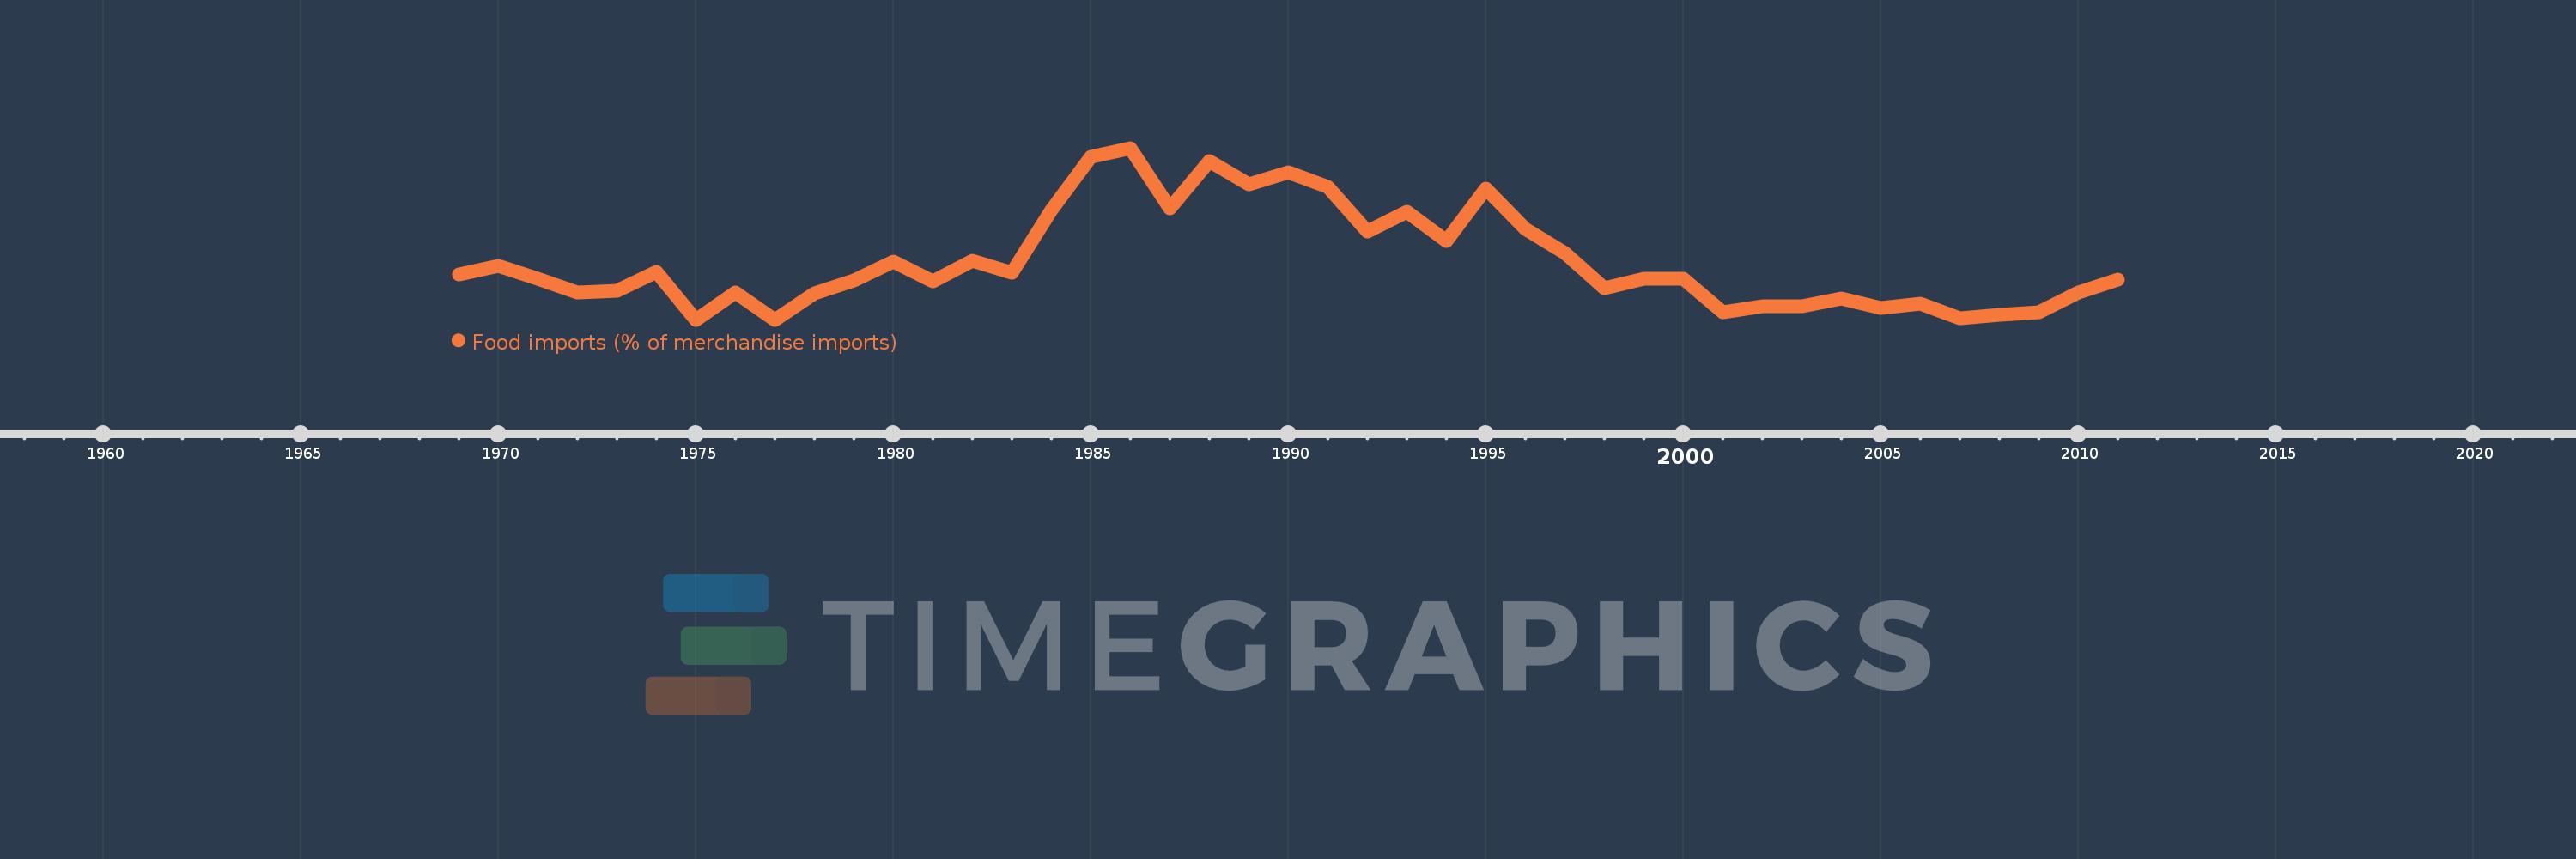
Food imports (% of merchandise imports)
2011,2010,2009,2008,2007,2006,2005,2004,2003,2002,2001,2000,1999,1998,1997,1996,1995,1994,1993,1992,1991,1990,1989,1988,1987,1986,1985,1984,1983,1982,1981,1980,1979,1978,1977,1976,1975,1974,1973,1972,1971,1970,1969
This statistics in other country:
AfghanistanAlbaniaAlgeriaAndorraAngolaAntigua and BarbudaArab WorldArgentinaArmeniaArubaAustraliaAustriaAzerbaijanBahamas, TheBahrainBangladeshBarbadosBelarusBelgiumBelizeBeninBermudaBhutanBoliviaBosnia and HerzegovinaBotswanaBrazilBrunei DarussalamBulgariaBurkina FasoBurundiCabo VerdeCambodiaCameroonCanadaCaribbean small statesCayman IslandsCentral African RepublicCentral Europe and the BalticsChadChileChinaColombiaComorosCongo, Dem. Rep.Congo, Rep.Costa RicaCote d'IvoireCroatiaCubaCyprusCzech RepublicDenmarkDjiboutiDominicaDominican RepublicEarly-demographic dividendEast Asia & PacificEast Asia & Pacific (excluding high income)East Asia & Pacific (IDA & IBRD countries)EcuadorEgypt, Arab Rep.El SalvadorEquatorial GuineaEritreaEstoniaEthiopiaEuro areaEurope & Central AsiaEurope & Central Asia (excluding high income)Europe & Central Asia (IDA & IBRD countries)European UnionFaroe IslandsFijiFinlandFragile and conflict affected situationsFranceFrench PolynesiaGabonGambia, TheGeorgiaGermanyGhanaGreeceGreenlandGrenadaGuatemalaGuineaGuinea-BissauGuyanaHaitiHeavily indebted poor countries (HIPC)High incomeHondurasHong Kong SAR, ChinaHungaryIBRD onlyIcelandIDA & IBRD totalIDA blendIDA onlyIDA totalIndiaIndonesiaIran, Islamic Rep.IraqIrelandIsraelItalyJamaicaJapanJordanKazakhstanKenyaKiribatiKorea, Rep.KuwaitKyrgyz RepublicLao PDRLate-demographic dividendLatin America & Caribbean Latin America & Caribbean (excluding high income)Latin America & the Caribbean (IDA & IBRD countries)LatviaLeast developed countries: UN classificationLebanonLesothoLiberiaLibyaLithuaniaLow & middle incomeLow incomeLower middle incomeLuxembourgMacao SAR, ChinaMacedonia, FYRMadagascarMalawiMalaysiaMaldivesMaliMaltaMauritaniaMauritiusMexicoMiddle East & North AfricaMiddle East & North Africa (excluding high income)Middle East & North Africa (IDA & IBRD countries)Middle incomeMoldovaMongoliaMoroccoMozambiqueMyanmarNamibiaNepalNetherlandsNew CaledoniaNew ZealandNicaraguaNigerNigeriaNorth AmericaNorwayOECD membersOmanOther small statesPacific island small statesPakistanPalauPanamaPapua New GuineaParaguayPeruPhilippinesPolandPortugalPost-demographic dividendPre-demographic dividendQatarRomaniaRussian FederationRwandaSamoaSao Tome and PrincipeSaudi ArabiaSenegalSerbiaSeychellesSierra LeoneSingaporeSlovak RepublicSloveniaSmall statesSolomon IslandsSomaliaSouth AfricaSouth AsiaSouth Asia (IDA & IBRD)SpainSri LankaSt. Kitts and NevisSt. LuciaSt. Vincent and the GrenadinesSub-Saharan Africa Sub-Saharan Africa (excluding high income)Sub-Saharan Africa (IDA & IBRD countries)SudanSurinameSwazilandSwedenSwitzerlandSyrian Arab RepublicTajikistanTanzaniaThailandTimor-LesteTogoTongaTrinidad and TobagoTunisiaTurkeyTurkmenistanTurks and Caicos IslandsTuvaluUgandaUkraineUnited Arab EmiratesUnited KingdomUnited StatesUpper middle incomeUruguayVanuatuVenezuela, RBVietnamVirgin Islands (U.S.)WorldYemen, Rep.ZambiaZimbabwe Timeline:
This timeline shows a graph from 1969 to 2011 of Trinidad and Tobago. No data until 1968. Number of actual observations by date: 43.
Source name:
World Development Indicators
Source organization:
World Bank staff estimates from the Comtrade database maintained by the United Nations Statistics Division.
Categories, topics:
Private Sector, Trade
Last updated:
apr 23, 2017
Indicators value changes by year
Maximum:
22.893
jan 1, 1986
At the date of observation
Value
Absolute change
Change from previous value
jan 1, 1969
11.677
+11.677
0.0%
jan 1, 1970
12.433
+0.756
6.47%
jan 1, 1971
11.255
-1.177
-9.47%
jan 1, 1972
10.065
-1.19
-10.58%
jan 1, 1973
10.173
+0.108
1.08%
jan 1, 1974
11.844
+1.671
16.42%
jan 1, 1975
7.624
-4.22
-35.63%
jan 1, 1976
10.064
+2.44
32.01%
jan 1, 1977
7.631
-2.433
-24.17%
jan 1, 1978
9.98
+2.349
30.78%
jan 1, 1979
11.111
+1.131
11.33%
jan 1, 1980
12.787
+1.676
15.08%
jan 1, 1981
11.072
-1.715
-13.41%
jan 1, 1982
12.881
+1.81
16.34%
jan 1, 1983
11.836
-1.045
-8.12%
jan 1, 1984
17.369
+5.533
46.75%
jan 1, 1985
22.11
+4.741
27.3%
jan 1, 1986
22.893
+0.782
3.54%
jan 1, 1987
17.545
-5.347
-23.36%
jan 1, 1988
21.719
+4.174
23.79%
jan 1, 1989
19.665
-2.054
-9.46%
jan 1, 1990
20.745
+1.08
5.49%
jan 1, 1991
19.407
-1.338
-6.45%
jan 1, 1992
15.434
-3.973
-20.47%
jan 1, 1993
17.21
+1.775
11.5%
jan 1, 1994
14.599
-2.61
-15.17%
jan 1, 1995
19.304
+4.705
32.22%
jan 1, 1996
15.68
-3.624
-18.77%
jan 1, 1997
13.532
-2.147
-13.69%
jan 1, 1998
10.428
-3.104
-22.94%
jan 1, 1999
11.281
+0.852
8.17%
jan 1, 2000
11.3
+0.019
0.17%
jan 1, 2001
8.314
-2.986
-26.42%
jan 1, 2002
8.828
+0.514
6.18%
jan 1, 2003
8.789
-0.039
-0.44%
jan 1, 2004
9.478
+0.689
7.84%
jan 1, 2005
8.644
-0.834
-8.8%
jan 1, 2006
9.022
+0.378
4.37%
jan 1, 2007
7.781
-1.241
-13.76%
jan 1, 2008
8.084
+0.303
3.9%
jan 1, 2009
8.255
+0.171
2.11%
jan 1, 2010
10.056
+1.801
21.81%
jan 1, 2011
11.19
+1.134
11.28%
Ranking of countries by current statistics by years


Comments: