29
/
en
AIzaSyAYiBZKx7MnpbEhh9jyipgxe19OcubqV5w
April 1, 2024
212937
Nigeria
NGA
true
2
1
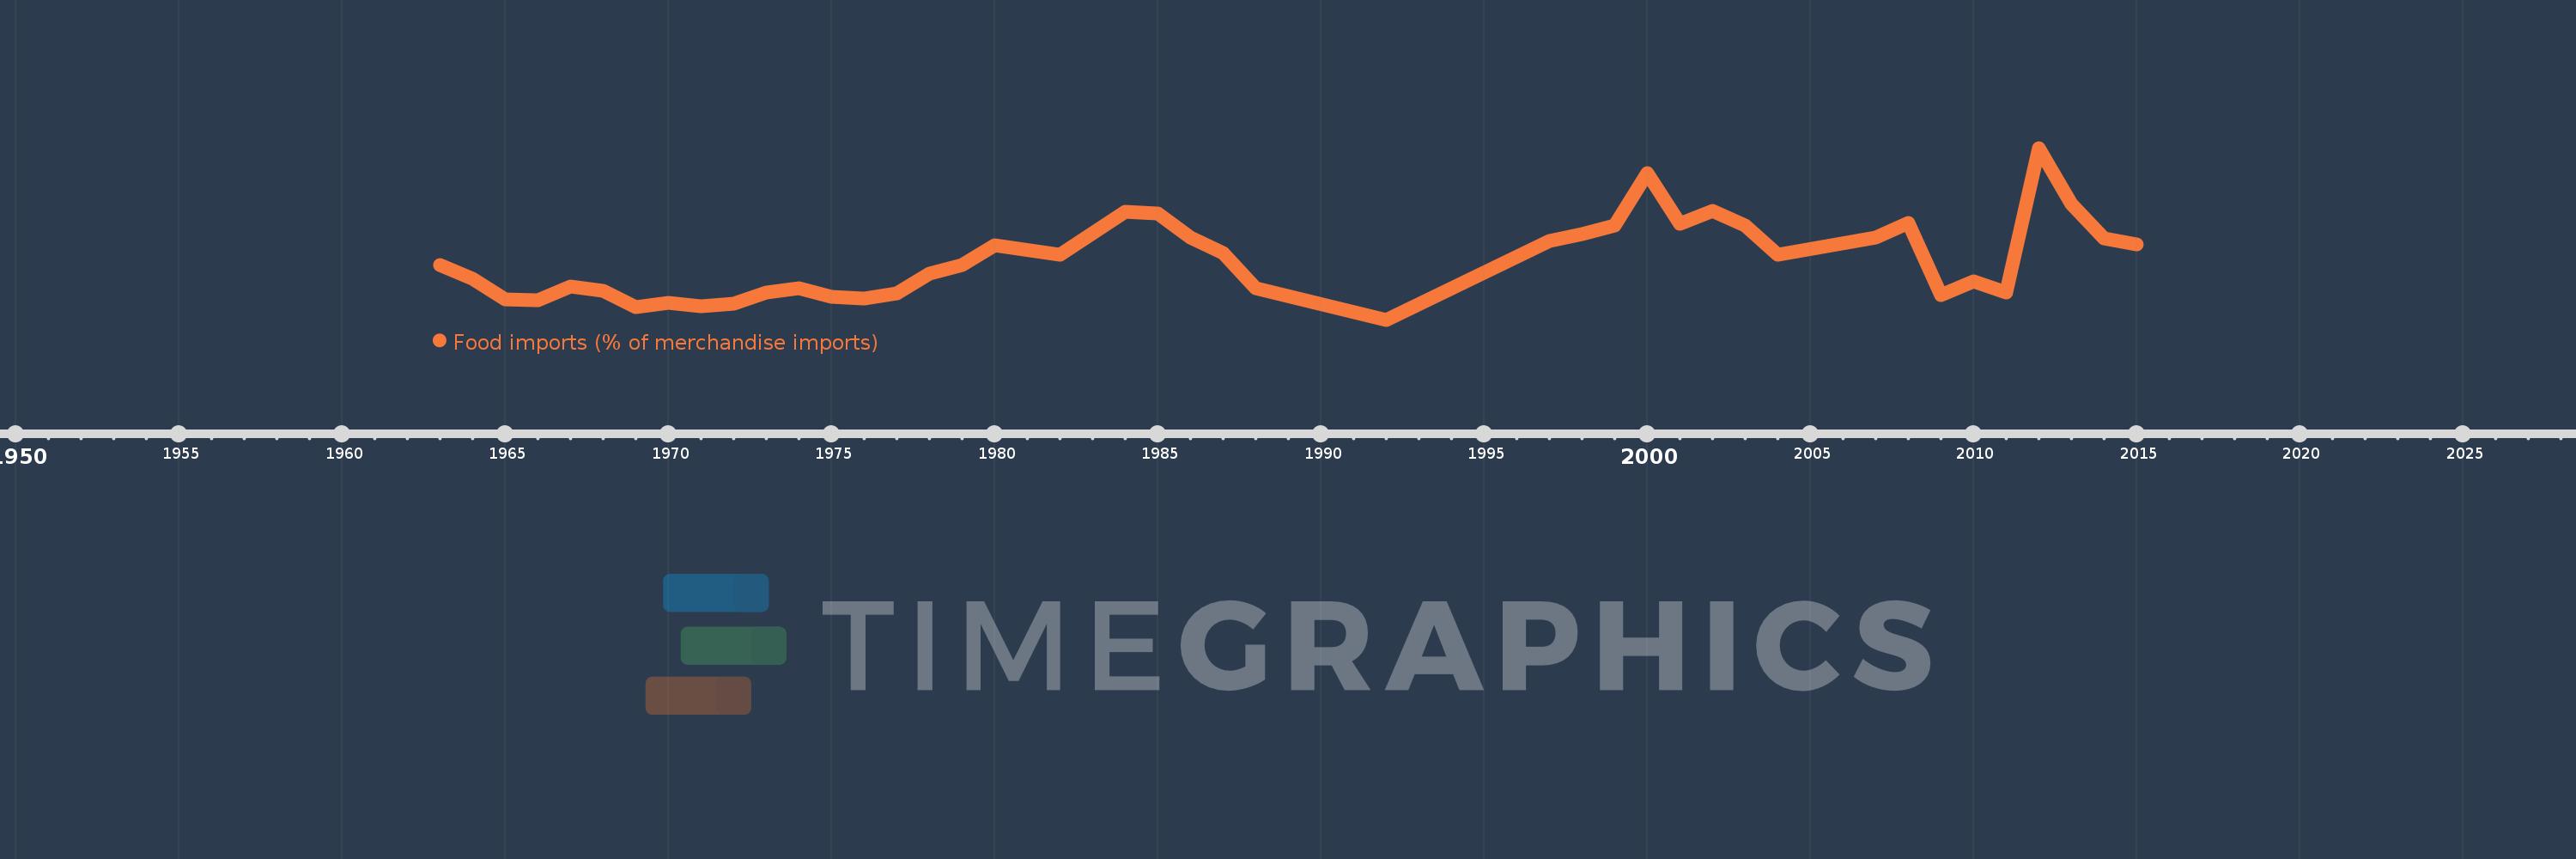
Food imports (% of merchandise imports)
2015,2014,2013,2012,2011,2010,2009,2008,2007,2004,2003,2002,2001,2000,1999,1998,1997,1992,1988,1987,1986,1985,1984,1982,1980,1979,1978,1977,1976,1975,1974,1973,1972,1971,1970,1969,1968,1967,1966,1965,1964,1963
This statistics in other country:
AfghanistanAlbaniaAlgeriaAndorraAngolaAntigua and BarbudaArab WorldArgentinaArmeniaArubaAustraliaAustriaAzerbaijanBahamas, TheBahrainBangladeshBarbadosBelarusBelgiumBelizeBeninBermudaBhutanBoliviaBosnia and HerzegovinaBotswanaBrazilBrunei DarussalamBulgariaBurkina FasoBurundiCabo VerdeCambodiaCameroonCanadaCaribbean small statesCayman IslandsCentral African RepublicCentral Europe and the BalticsChadChileChinaColombiaComorosCongo, Dem. Rep.Congo, Rep.Costa RicaCote d'IvoireCroatiaCubaCyprusCzech RepublicDenmarkDjiboutiDominicaDominican RepublicEarly-demographic dividendEast Asia & PacificEast Asia & Pacific (excluding high income)East Asia & Pacific (IDA & IBRD countries)EcuadorEgypt, Arab Rep.El SalvadorEquatorial GuineaEritreaEstoniaEthiopiaEuro areaEurope & Central AsiaEurope & Central Asia (excluding high income)Europe & Central Asia (IDA & IBRD countries)European UnionFaroe IslandsFijiFinlandFragile and conflict affected situationsFranceFrench PolynesiaGabonGambia, TheGeorgiaGermanyGhanaGreeceGreenlandGrenadaGuatemalaGuineaGuinea-BissauGuyanaHaitiHeavily indebted poor countries (HIPC)High incomeHondurasHong Kong SAR, ChinaHungaryIBRD onlyIcelandIDA & IBRD totalIDA blendIDA onlyIDA totalIndiaIndonesiaIran, Islamic Rep.IraqIrelandIsraelItalyJamaicaJapanJordanKazakhstanKenyaKiribatiKorea, Rep.KuwaitKyrgyz RepublicLao PDRLate-demographic dividendLatin America & Caribbean Latin America & Caribbean (excluding high income)Latin America & the Caribbean (IDA & IBRD countries)LatviaLeast developed countries: UN classificationLebanonLesothoLiberiaLibyaLithuaniaLow & middle incomeLow incomeLower middle incomeLuxembourgMacao SAR, ChinaMacedonia, FYRMadagascarMalawiMalaysiaMaldivesMaliMaltaMauritaniaMauritiusMexicoMiddle East & North AfricaMiddle East & North Africa (excluding high income)Middle East & North Africa (IDA & IBRD countries)Middle incomeMoldovaMongoliaMoroccoMozambiqueMyanmarNamibiaNepalNetherlandsNew CaledoniaNew ZealandNicaraguaNigerNigeriaNorth AmericaNorwayOECD membersOmanOther small statesPacific island small statesPakistanPalauPanamaPapua New GuineaParaguayPeruPhilippinesPolandPortugalPost-demographic dividendPre-demographic dividendQatarRomaniaRussian FederationRwandaSamoaSao Tome and PrincipeSaudi ArabiaSenegalSerbiaSeychellesSierra LeoneSingaporeSlovak RepublicSloveniaSmall statesSolomon IslandsSomaliaSouth AfricaSouth AsiaSouth Asia (IDA & IBRD)SpainSri LankaSt. Kitts and NevisSt. LuciaSt. Vincent and the GrenadinesSub-Saharan Africa Sub-Saharan Africa (excluding high income)Sub-Saharan Africa (IDA & IBRD countries)SudanSurinameSwazilandSwedenSwitzerlandSyrian Arab RepublicTajikistanTanzaniaThailandTimor-LesteTogoTongaTrinidad and TobagoTunisiaTurkeyTurkmenistanTurks and Caicos IslandsTuvaluUgandaUkraineUnited Arab EmiratesUnited KingdomUnited StatesUpper middle incomeUruguayVanuatuVenezuela, RBVietnamVirgin Islands (U.S.)WorldYemen, Rep.ZambiaZimbabwe Timeline:
This timeline shows a graph from 1963 to 2015 of Nigeria. No data until 1962. Number of actual observations by date: 42.
Source name:
World Development Indicators
Source organization:
World Bank staff estimates from the Comtrade database maintained by the United Nations Statistics Division.
Categories, topics:
Private Sector, Trade
Last updated:
apr 23, 2017
Indicators value changes by year
Maximum:
30.561
jan 1, 2012
At the date of observation
Value
Absolute change
Change from previous value
jan 1, 1963
14.13
+14.13
0.0%
jan 1, 1964
12.139
-1.991
-14.09%
jan 1, 1965
9.237
-2.902
-23.9%
jan 1, 1966
9.142
-0.095
-1.03%
jan 1, 1967
11.017
+1.875
20.51%
jan 1, 1968
10.47
-0.547
-4.97%
jan 1, 1969
8.103
-2.368
-22.61%
jan 1, 1970
8.784
+0.682
8.42%
jan 1, 1971
8.245
-0.54
-6.15%
jan 1, 1972
8.625
+0.381
4.62%
jan 1, 1973
10.141
+1.515
17.57%
jan 1, 1974
10.816
+0.676
6.66%
jan 1, 1975
9.533
-1.283
-11.86%
jan 1, 1976
9.38
-0.153
-1.61%
jan 1, 1977
10.108
+0.728
7.76%
jan 1, 1978
12.87
+2.762
27.32%
jan 1, 1979
14.13
+1.26
9.79%
jan 1, 1980
16.847
+2.717
19.23%
jan 1, 1982
15.544
-1.303
-7.73%
jan 1, 1984
21.555
+6.011
38.67%
jan 1, 1985
21.288
-0.267
-1.24%
jan 1, 1986
17.957
-3.331
-15.65%
jan 1, 1987
15.77
-2.187
-12.18%
jan 1, 1988
10.86
-4.91
-31.13%
jan 1, 1992
6.363
-4.496
-41.4%
jan 1, 1997
17.508
+11.144
175.13%
jan 1, 1998
18.387
+0.879
5.02%
jan 1, 1999
19.597
+1.21
6.58%
jan 1, 2000
27.021
+7.424
37.88%
jan 1, 2001
19.917
-7.105
-26.29%
jan 1, 2002
21.704
+1.787
8.97%
jan 1, 2003
19.576
-2.128
-9.8%
jan 1, 2004
15.496
-4.08
-20.84%
jan 1, 2007
17.955
+2.459
15.87%
jan 1, 2008
20.058
+2.103
11.71%
jan 1, 2009
9.777
-10.281
-51.26%
jan 1, 2010
11.828
+2.051
20.97%
jan 1, 2011
10.248
-1.579
-13.35%
jan 1, 2012
30.561
+20.313
198.21%
jan 1, 2013
22.71
-7.852
-25.69%
jan 1, 2014
17.829
-4.881
-21.49%
jan 1, 2015
17.027
-0.802
-4.5%
Ranking of countries by current statistics by years


Comments: