30
/
AIzaSyAYiBZKx7MnpbEhh9jyipgxe19OcubqV5w
April 1, 2024
219556
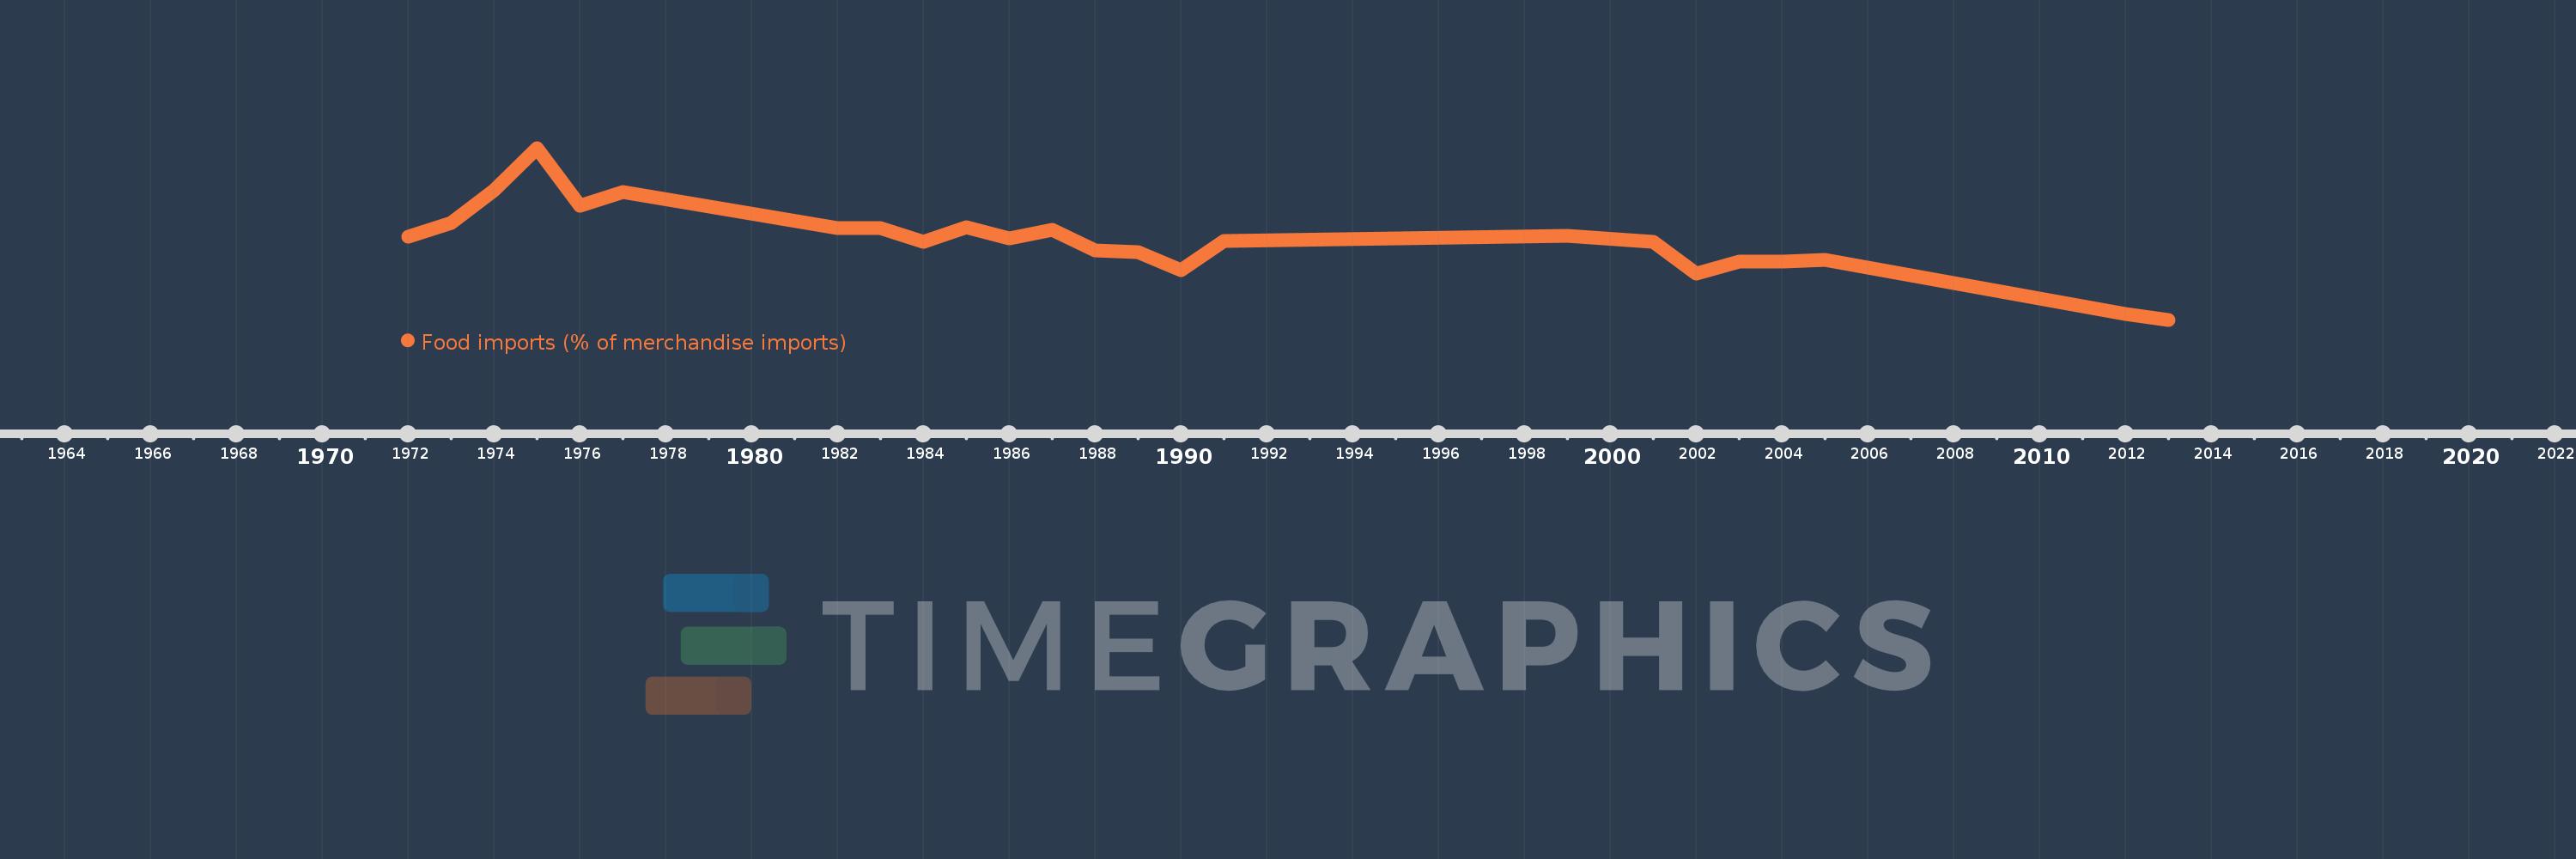
Papua New Guinea
PNG
true
2
1
Food imports (% of merchandise imports)
2013,2012,2005,2004,2003,2002,2001,1999,1991,1990,1989,1988,1987,1986,1985,1984,1983,1982,1977,1976,1975,1974,1973,1972
