29
/
en
AIzaSyAYiBZKx7MnpbEhh9jyipgxe19OcubqV5w
April 1, 2024
43410
Latin America & the Caribbean (IDA & IBRD countries)
TLA
false
2
1
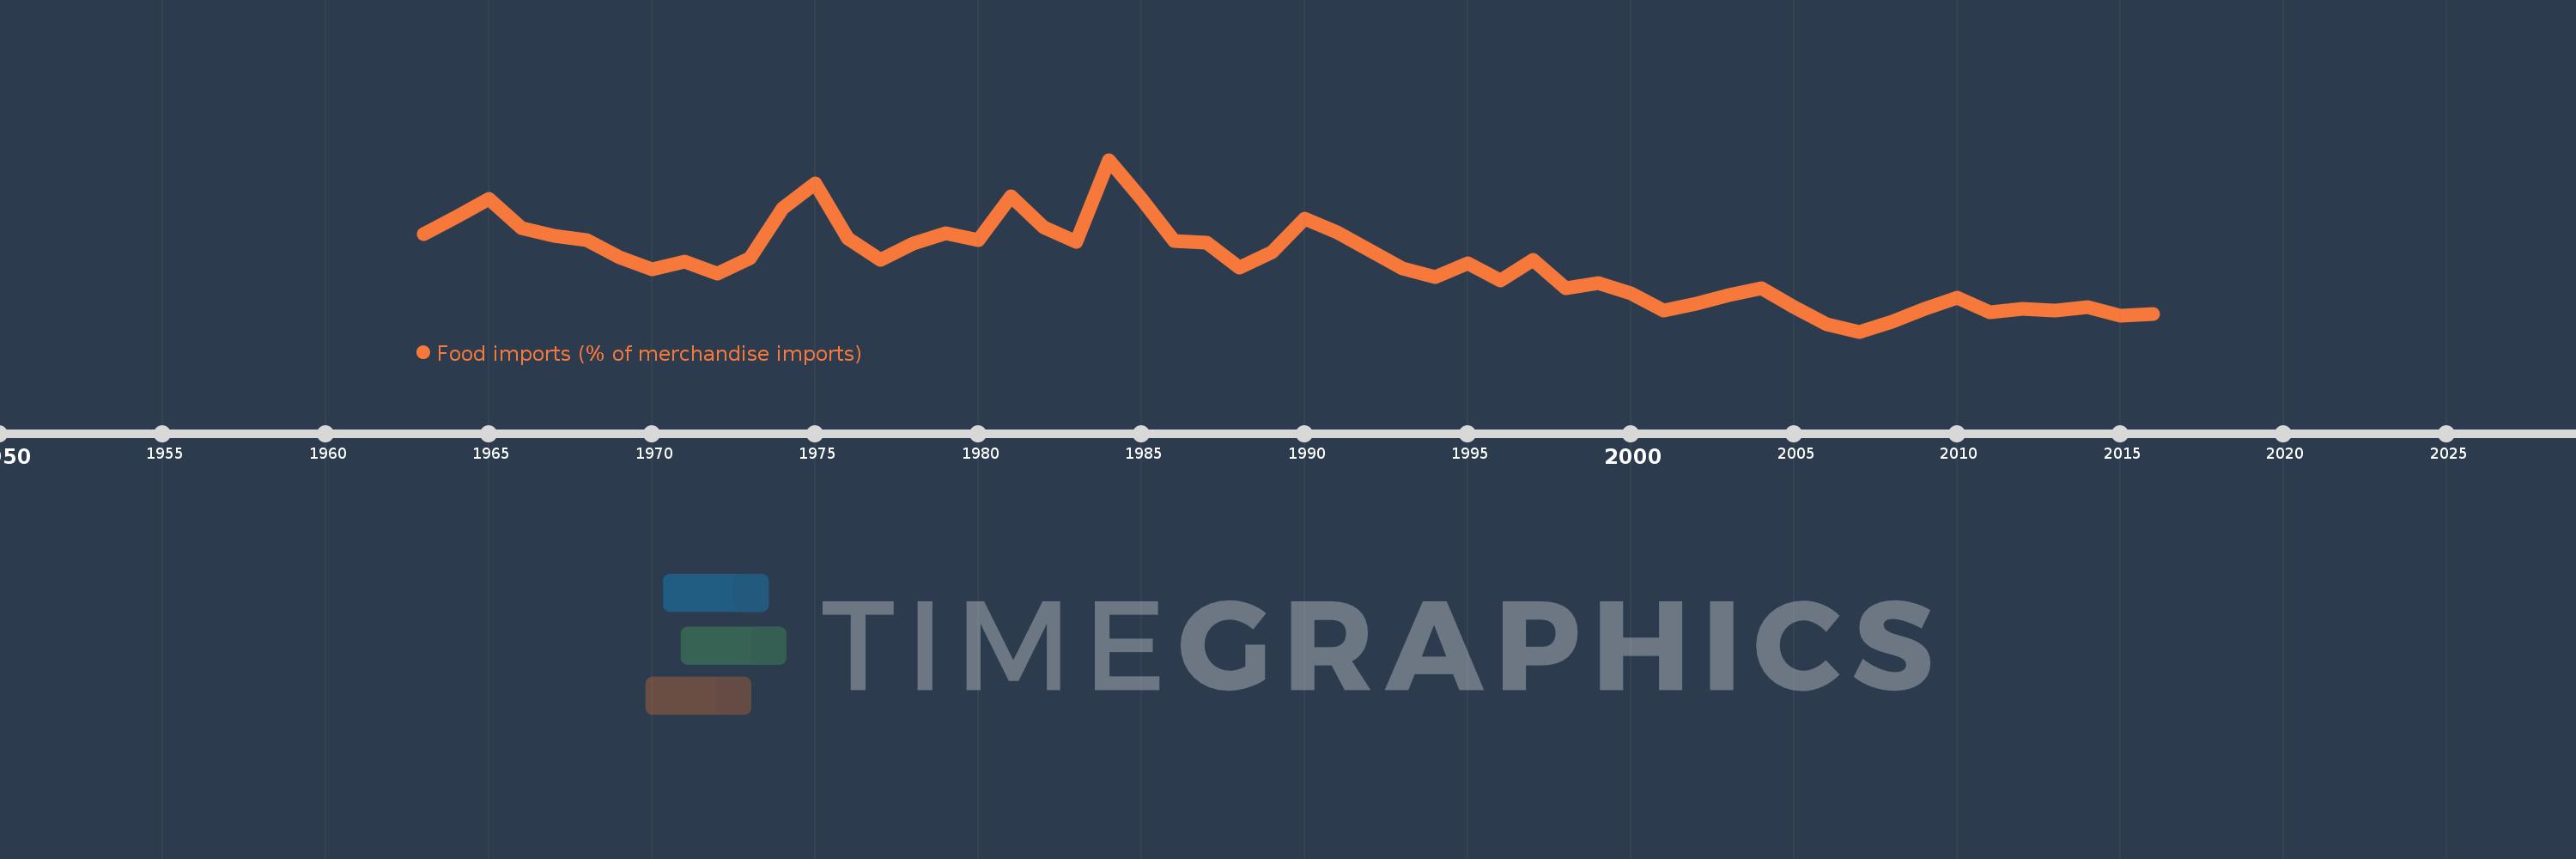
Food imports (% of merchandise imports)
2016,2015,2014,2013,2012,2011,2010,2009,2008,2007,2006,2005,2004,2003,2002,2001,2000,1999,1998,1997,1996,1995,1994,1993,1992,1991,1990,1989,1988,1987,1986,1985,1984,1983,1982,1981,1980,1979,1978,1977,1976,1975,1974,1973,1972,1971,1970,1969,1968,1967,1966,1965,1964,1963
This statistics in other country:
AfghanistanAlbaniaAlgeriaAndorraAngolaAntigua and BarbudaArab WorldArgentinaArmeniaArubaAustraliaAustriaAzerbaijanBahamas, TheBahrainBangladeshBarbadosBelarusBelgiumBelizeBeninBermudaBhutanBoliviaBosnia and HerzegovinaBotswanaBrazilBrunei DarussalamBulgariaBurkina FasoBurundiCabo VerdeCambodiaCameroonCanadaCaribbean small statesCayman IslandsCentral African RepublicCentral Europe and the BalticsChadChileChinaColombiaComorosCongo, Dem. Rep.Congo, Rep.Costa RicaCote d'IvoireCroatiaCubaCyprusCzech RepublicDenmarkDjiboutiDominicaDominican RepublicEarly-demographic dividendEast Asia & PacificEast Asia & Pacific (excluding high income)East Asia & Pacific (IDA & IBRD countries)EcuadorEgypt, Arab Rep.El SalvadorEquatorial GuineaEritreaEstoniaEthiopiaEuro areaEurope & Central AsiaEurope & Central Asia (excluding high income)Europe & Central Asia (IDA & IBRD countries)European UnionFaroe IslandsFijiFinlandFragile and conflict affected situationsFranceFrench PolynesiaGabonGambia, TheGeorgiaGermanyGhanaGreeceGreenlandGrenadaGuatemalaGuineaGuinea-BissauGuyanaHaitiHeavily indebted poor countries (HIPC)High incomeHondurasHong Kong SAR, ChinaHungaryIBRD onlyIcelandIDA & IBRD totalIDA blendIDA onlyIDA totalIndiaIndonesiaIran, Islamic Rep.IraqIrelandIsraelItalyJamaicaJapanJordanKazakhstanKenyaKiribatiKorea, Rep.KuwaitKyrgyz RepublicLao PDRLate-demographic dividendLatin America & Caribbean Latin America & Caribbean (excluding high income)Latin America & the Caribbean (IDA & IBRD countries)LatviaLeast developed countries: UN classificationLebanonLesothoLiberiaLibyaLithuaniaLow & middle incomeLow incomeLower middle incomeLuxembourgMacao SAR, ChinaMacedonia, FYRMadagascarMalawiMalaysiaMaldivesMaliMaltaMauritaniaMauritiusMexicoMiddle East & North AfricaMiddle East & North Africa (excluding high income)Middle East & North Africa (IDA & IBRD countries)Middle incomeMoldovaMongoliaMoroccoMozambiqueMyanmarNamibiaNepalNetherlandsNew CaledoniaNew ZealandNicaraguaNigerNigeriaNorth AmericaNorwayOECD membersOmanOther small statesPacific island small statesPakistanPalauPanamaPapua New GuineaParaguayPeruPhilippinesPolandPortugalPost-demographic dividendPre-demographic dividendQatarRomaniaRussian FederationRwandaSamoaSao Tome and PrincipeSaudi ArabiaSenegalSerbiaSeychellesSierra LeoneSingaporeSlovak RepublicSloveniaSmall statesSolomon IslandsSomaliaSouth AfricaSouth AsiaSouth Asia (IDA & IBRD)SpainSri LankaSt. Kitts and NevisSt. LuciaSt. Vincent and the GrenadinesSub-Saharan Africa Sub-Saharan Africa (excluding high income)Sub-Saharan Africa (IDA & IBRD countries)SudanSurinameSwazilandSwedenSwitzerlandSyrian Arab RepublicTajikistanTanzaniaThailandTimor-LesteTogoTongaTrinidad and TobagoTunisiaTurkeyTurkmenistanTurks and Caicos IslandsTuvaluUgandaUkraineUnited Arab EmiratesUnited KingdomUnited StatesUpper middle incomeUruguayVanuatuVenezuela, RBVietnamVirgin Islands (U.S.)WorldYemen, Rep.ZambiaZimbabwe Timeline:
This timeline shows a graph from 1963 to 2016 of Latin America & the Caribbean (IDA & IBRD countries). No data until 1962. Number of actual observations by date: 54.
Source name:
World Development Indicators
Source organization:
World Bank staff estimates from the Comtrade database maintained by the United Nations Statistics Division.
Categories, topics:
Private Sector, Trade
Last updated:
apr 23, 2017
Indicators value changes by year
Maximum:
14.899
jan 1, 1984
At the date of observation
Value
Absolute change
Change from previous value
jan 1, 1963
11.229
+11.229
0.0%
jan 1, 1964
12.05
+0.821
7.31%
jan 1, 1965
12.952
+0.902
7.48%
jan 1, 1966
11.498
-1.454
-11.23%
jan 1, 1967
11.105
-0.393
-3.41%
jan 1, 1968
10.925
-0.18
-1.62%
jan 1, 1969
10.068
-0.857
-7.84%
jan 1, 1970
9.46
-0.608
-6.04%
jan 1, 1971
9.847
+0.387
4.09%
jan 1, 1972
9.24
-0.607
-6.17%
jan 1, 1973
10.001
+0.761
8.24%
jan 1, 1974
12.511
+2.51
25.1%
jan 1, 1975
13.742
+1.231
9.84%
jan 1, 1976
11.002
-2.74
-19.94%
jan 1, 1977
9.948
-1.054
-9.58%
jan 1, 1978
10.753
+0.805
8.09%
jan 1, 1979
11.25
+0.497
4.62%
jan 1, 1980
10.905
-0.345
-3.07%
jan 1, 1981
13.075
+2.169
19.89%
jan 1, 1982
11.562
-1.513
-11.57%
jan 1, 1983
10.819
-0.743
-6.43%
jan 1, 1984
14.899
+4.08
37.72%
jan 1, 1985
12.939
-1.96
-13.16%
jan 1, 1986
10.849
-2.09
-16.15%
jan 1, 1987
10.784
-0.065
-0.6%
jan 1, 1988
9.56
-1.224
-11.35%
jan 1, 1989
10.336
+0.776
8.11%
jan 1, 1990
11.989
+1.653
15.99%
jan 1, 1991
11.315
-0.674
-5.62%
jan 1, 1992
10.412
-0.903
-7.98%
jan 1, 1993
9.516
-0.896
-8.61%
jan 1, 1994
9.079
-0.437
-4.6%
jan 1, 1995
9.769
+0.691
7.61%
jan 1, 1996
8.913
-0.857
-8.77%
jan 1, 1997
9.939
+1.027
11.52%
jan 1, 1998
8.505
-1.434
-14.43%
jan 1, 1999
8.796
+0.291
3.42%
jan 1, 2000
8.281
-0.515
-5.85%
jan 1, 2001
7.409
-0.872
-10.53%
jan 1, 2002
7.745
+0.336
4.54%
jan 1, 2003
8.166
+0.421
5.44%
jan 1, 2004
8.508
+0.342
4.19%
jan 1, 2005
7.568
-0.94
-11.05%
jan 1, 2006
6.743
-0.825
-10.9%
jan 1, 2007
6.371
-0.372
-5.51%
jan 1, 2008
6.865
+0.493
7.75%
jan 1, 2009
7.514
+0.649
9.46%
jan 1, 2010
8.052
+0.538
7.16%
jan 1, 2011
7.35
-0.702
-8.72%
jan 1, 2012
7.506
+0.156
2.12%
jan 1, 2013
7.403
-0.103
-1.37%
jan 1, 2014
7.586
+0.183
2.47%
jan 1, 2015
7.163
-0.423
-5.57%
jan 1, 2016
7.225
+0.062
0.87%
Ranking of countries by current statistics by years


Comments: