29
/
en
AIzaSyAYiBZKx7MnpbEhh9jyipgxe19OcubqV5w
April 1, 2024
280951
Venezuela, RB
VEN
true
2
1
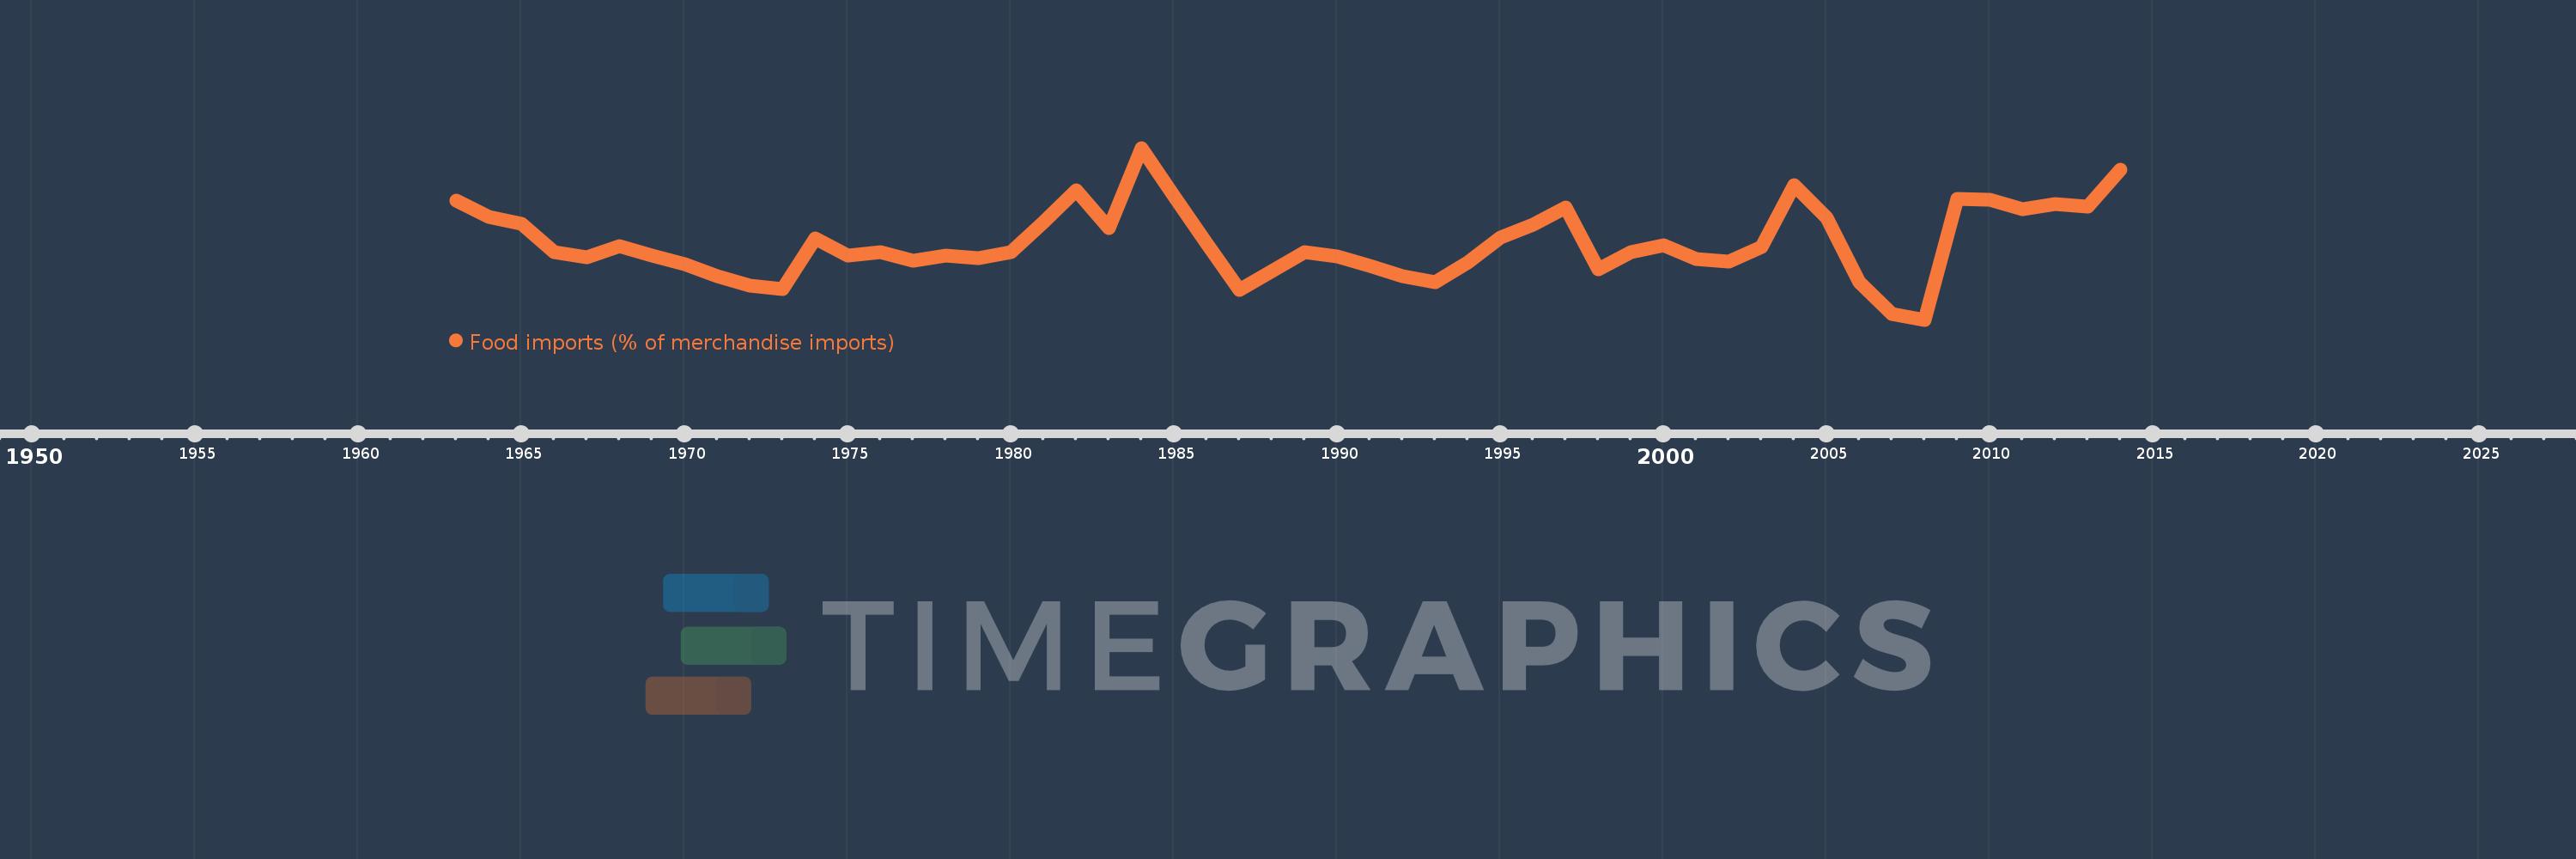
Food imports (% of merchandise imports)
2014,2013,2012,2011,2010,2009,2008,2007,2006,2005,2004,2003,2002,2001,2000,1999,1998,1997,1996,1995,1994,1993,1992,1991,1990,1989,1988,1987,1986,1985,1984,1983,1982,1981,1980,1979,1978,1977,1976,1975,1974,1973,1972,1971,1970,1969,1968,1967,1966,1965,1964,1963
This statistics in other country:
AfghanistanAlbaniaAlgeriaAndorraAngolaAntigua and BarbudaArab WorldArgentinaArmeniaArubaAustraliaAustriaAzerbaijanBahamas, TheBahrainBangladeshBarbadosBelarusBelgiumBelizeBeninBermudaBhutanBoliviaBosnia and HerzegovinaBotswanaBrazilBrunei DarussalamBulgariaBurkina FasoBurundiCabo VerdeCambodiaCameroonCanadaCaribbean small statesCayman IslandsCentral African RepublicCentral Europe and the BalticsChadChileChinaColombiaComorosCongo, Dem. Rep.Congo, Rep.Costa RicaCote d'IvoireCroatiaCubaCyprusCzech RepublicDenmarkDjiboutiDominicaDominican RepublicEarly-demographic dividendEast Asia & PacificEast Asia & Pacific (excluding high income)East Asia & Pacific (IDA & IBRD countries)EcuadorEgypt, Arab Rep.El SalvadorEquatorial GuineaEritreaEstoniaEthiopiaEuro areaEurope & Central AsiaEurope & Central Asia (excluding high income)Europe & Central Asia (IDA & IBRD countries)European UnionFaroe IslandsFijiFinlandFragile and conflict affected situationsFranceFrench PolynesiaGabonGambia, TheGeorgiaGermanyGhanaGreeceGreenlandGrenadaGuatemalaGuineaGuinea-BissauGuyanaHaitiHeavily indebted poor countries (HIPC)High incomeHondurasHong Kong SAR, ChinaHungaryIBRD onlyIcelandIDA & IBRD totalIDA blendIDA onlyIDA totalIndiaIndonesiaIran, Islamic Rep.IraqIrelandIsraelItalyJamaicaJapanJordanKazakhstanKenyaKiribatiKorea, Rep.KuwaitKyrgyz RepublicLao PDRLate-demographic dividendLatin America & Caribbean Latin America & Caribbean (excluding high income)Latin America & the Caribbean (IDA & IBRD countries)LatviaLeast developed countries: UN classificationLebanonLesothoLiberiaLibyaLithuaniaLow & middle incomeLow incomeLower middle incomeLuxembourgMacao SAR, ChinaMacedonia, FYRMadagascarMalawiMalaysiaMaldivesMaliMaltaMauritaniaMauritiusMexicoMiddle East & North AfricaMiddle East & North Africa (excluding high income)Middle East & North Africa (IDA & IBRD countries)Middle incomeMoldovaMongoliaMoroccoMozambiqueMyanmarNamibiaNepalNetherlandsNew CaledoniaNew ZealandNicaraguaNigerNigeriaNorth AmericaNorwayOECD membersOmanOther small statesPacific island small statesPakistanPalauPanamaPapua New GuineaParaguayPeruPhilippinesPolandPortugalPost-demographic dividendPre-demographic dividendQatarRomaniaRussian FederationRwandaSamoaSao Tome and PrincipeSaudi ArabiaSenegalSerbiaSeychellesSierra LeoneSingaporeSlovak RepublicSloveniaSmall statesSolomon IslandsSomaliaSouth AfricaSouth AsiaSouth Asia (IDA & IBRD)SpainSri LankaSt. Kitts and NevisSt. LuciaSt. Vincent and the GrenadinesSub-Saharan Africa Sub-Saharan Africa (excluding high income)Sub-Saharan Africa (IDA & IBRD countries)SudanSurinameSwazilandSwedenSwitzerlandSyrian Arab RepublicTajikistanTanzaniaThailandTimor-LesteTogoTongaTrinidad and TobagoTunisiaTurkeyTurkmenistanTurks and Caicos IslandsTuvaluUgandaUkraineUnited Arab EmiratesUnited KingdomUnited StatesUpper middle incomeUruguayVanuatuVenezuela, RBVietnamVirgin Islands (U.S.)WorldYemen, Rep.ZambiaZimbabwe Timeline:
This timeline shows a graph from 1963 to 2014 of Venezuela, RB. No data until 1962. Number of actual observations by date: 52.
Source name:
World Development Indicators
Source organization:
World Bank staff estimates from the Comtrade database maintained by the United Nations Statistics Division.
Categories, topics:
Private Sector, Trade
Last updated:
apr 23, 2017
Indicators value changes by year
Maximum:
20.075
jan 1, 1984
At the date of observation
Value
Absolute change
Change from previous value
jan 1, 1963
16.114
+16.114
0.0%
jan 1, 1964
14.898
-1.216
-7.55%
jan 1, 1965
14.324
-0.574
-3.85%
jan 1, 1966
12.243
-2.082
-14.53%
jan 1, 1967
11.855
-0.388
-3.17%
jan 1, 1968
12.661
+0.806
6.8%
jan 1, 1969
11.959
-0.702
-5.54%
jan 1, 1970
11.302
-0.657
-5.5%
jan 1, 1971
10.404
-0.898
-7.94%
jan 1, 1972
9.666
-0.738
-7.1%
jan 1, 1973
9.45
-0.216
-2.23%
jan 1, 1974
13.25
+3.801
40.22%
jan 1, 1975
11.977
-1.274
-9.61%
jan 1, 1976
12.232
+0.255
2.13%
jan 1, 1977
11.576
-0.656
-5.36%
jan 1, 1978
11.941
+0.366
3.16%
jan 1, 1979
11.766
-0.176
-1.47%
jan 1, 1980
12.238
+0.472
4.01%
jan 1, 1981
14.479
+2.241
18.31%
jan 1, 1982
16.862
+2.383
16.46%
jan 1, 1983
14.045
-2.817
-16.71%
jan 1, 1984
20.075
+6.03
42.94%
jan 1, 1985
16.446
-3.629
-18.08%
jan 1, 1986
12.884
-3.562
-21.66%
jan 1, 1987
9.374
-3.51
-27.24%
jan 1, 1988
10.769
+1.395
14.89%
jan 1, 1989
12.218
+1.449
13.46%
jan 1, 1990
11.908
-0.311
-2.54%
jan 1, 1991
11.198
-0.71
-5.96%
jan 1, 1992
10.366
-0.832
-7.43%
jan 1, 1993
9.944
-0.422
-4.07%
jan 1, 1994
11.446
+1.502
15.1%
jan 1, 1995
13.322
+1.876
16.39%
jan 1, 1996
14.29
+0.968
7.26%
jan 1, 1997
15.575
+1.285
8.99%
jan 1, 1998
10.936
-4.639
-29.79%
jan 1, 1999
12.184
+1.248
11.42%
jan 1, 2000
12.739
+0.555
4.55%
jan 1, 2001
11.682
-1.057
-8.3%
jan 1, 2002
11.492
-0.19
-1.62%
jan 1, 2003
12.588
+1.096
9.54%
jan 1, 2004
17.265
+4.677
37.16%
jan 1, 2005
14.813
-2.451
-14.2%
jan 1, 2006
9.922
-4.891
-33.02%
jan 1, 2007
7.517
-2.406
-24.24%
jan 1, 2008
7.112
-0.405
-5.39%
jan 1, 2009
16.23
+9.118
128.21%
jan 1, 2010
16.16
-0.069
-0.43%
jan 1, 2011
15.468
-0.693
-4.29%
jan 1, 2012
15.869
+0.401
2.59%
jan 1, 2013
15.635
-0.234
-1.47%
jan 1, 2014
18.405
+2.77
17.72%
Ranking of countries by current statistics by years


Comments: