29
/
en
AIzaSyAYiBZKx7MnpbEhh9jyipgxe19OcubqV5w
April 1, 2024
104849
Chile
CHL
true
2
1
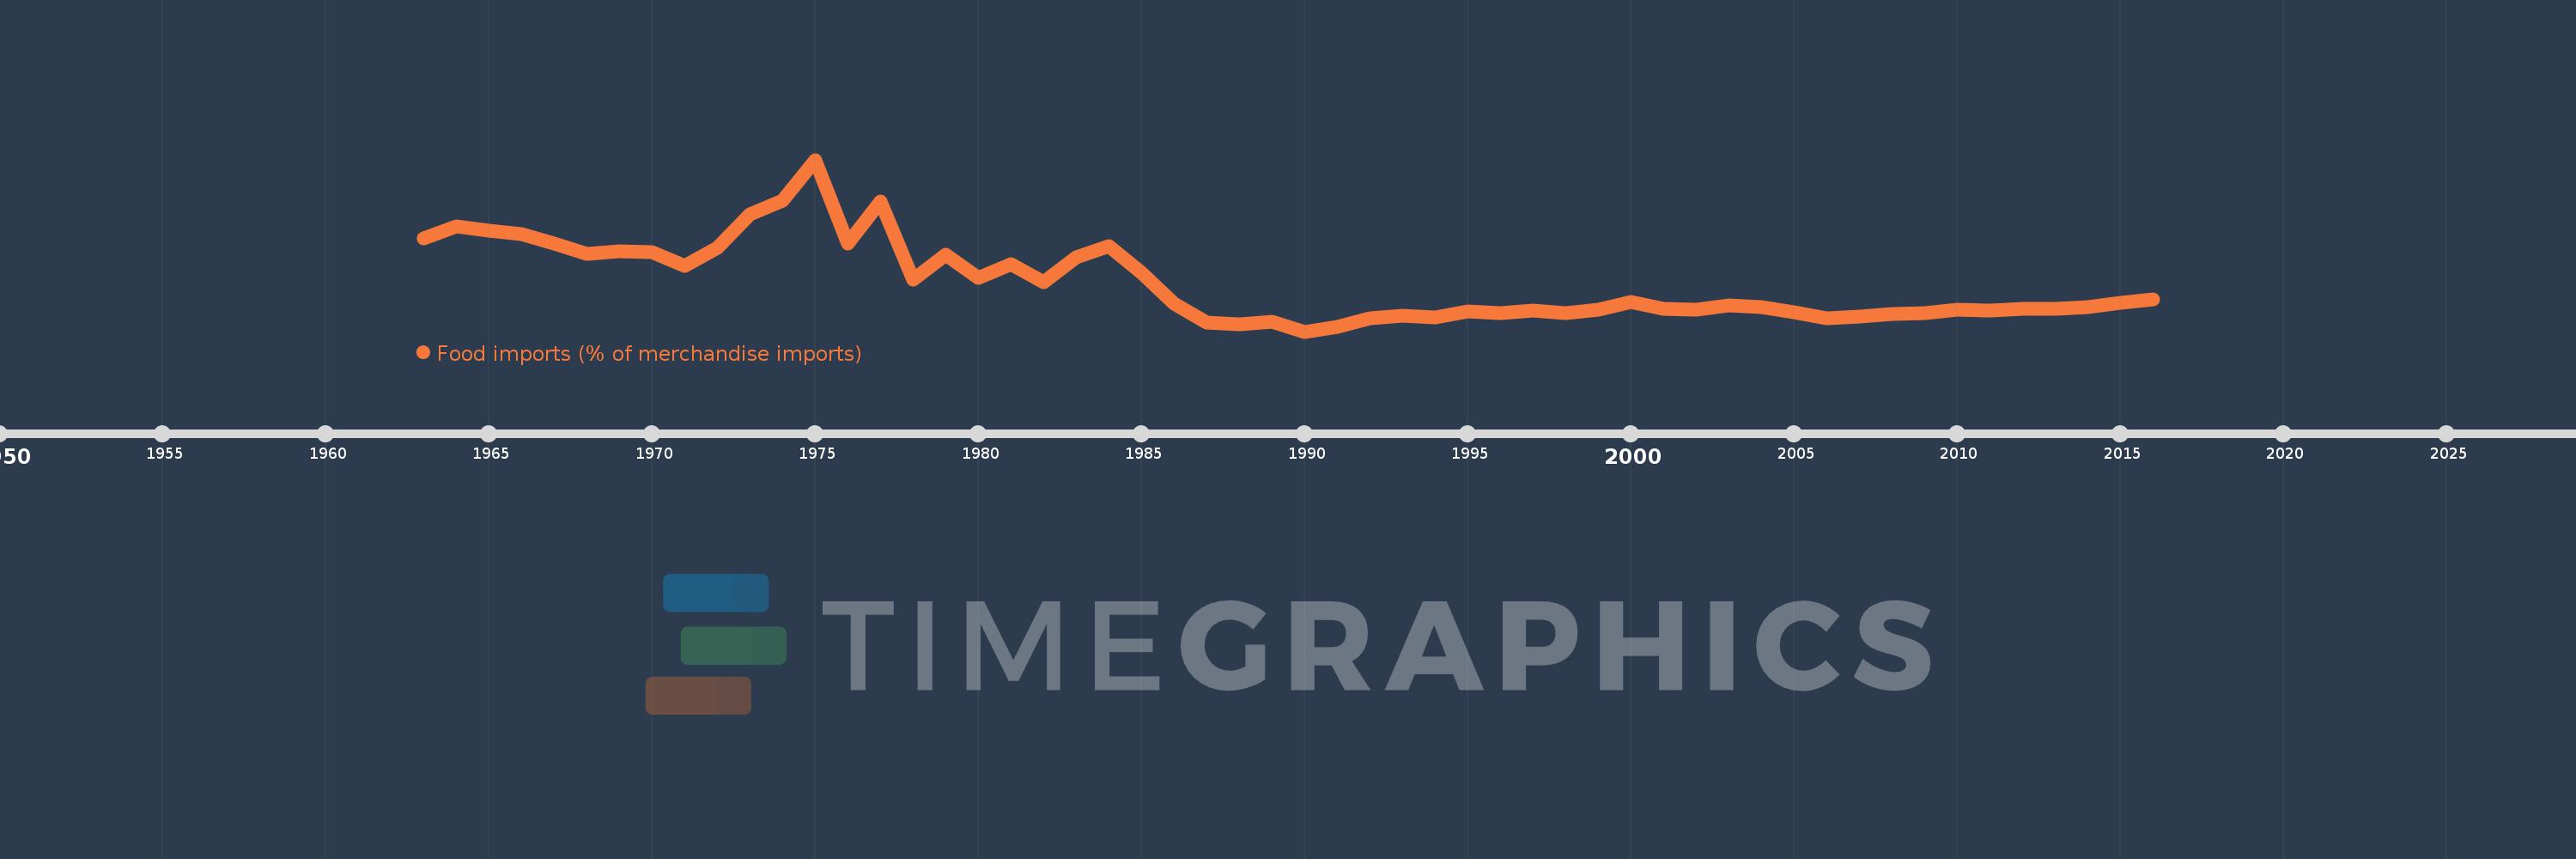
Food imports (% of merchandise imports)
2016,2015,2014,2013,2012,2011,2010,2009,2008,2007,2006,2005,2004,2003,2002,2001,2000,1999,1998,1997,1996,1995,1994,1993,1992,1991,1990,1989,1988,1987,1986,1985,1984,1983,1982,1981,1980,1979,1978,1977,1976,1975,1974,1973,1972,1971,1970,1969,1968,1967,1966,1965,1964,1963
This statistics in other country:
AfghanistanAlbaniaAlgeriaAndorraAngolaAntigua and BarbudaArab WorldArgentinaArmeniaArubaAustraliaAustriaAzerbaijanBahamas, TheBahrainBangladeshBarbadosBelarusBelgiumBelizeBeninBermudaBhutanBoliviaBosnia and HerzegovinaBotswanaBrazilBrunei DarussalamBulgariaBurkina FasoBurundiCabo VerdeCambodiaCameroonCanadaCaribbean small statesCayman IslandsCentral African RepublicCentral Europe and the BalticsChadChileChinaColombiaComorosCongo, Dem. Rep.Congo, Rep.Costa RicaCote d'IvoireCroatiaCubaCyprusCzech RepublicDenmarkDjiboutiDominicaDominican RepublicEarly-demographic dividendEast Asia & PacificEast Asia & Pacific (excluding high income)East Asia & Pacific (IDA & IBRD countries)EcuadorEgypt, Arab Rep.El SalvadorEquatorial GuineaEritreaEstoniaEthiopiaEuro areaEurope & Central AsiaEurope & Central Asia (excluding high income)Europe & Central Asia (IDA & IBRD countries)European UnionFaroe IslandsFijiFinlandFragile and conflict affected situationsFranceFrench PolynesiaGabonGambia, TheGeorgiaGermanyGhanaGreeceGreenlandGrenadaGuatemalaGuineaGuinea-BissauGuyanaHaitiHeavily indebted poor countries (HIPC)High incomeHondurasHong Kong SAR, ChinaHungaryIBRD onlyIcelandIDA & IBRD totalIDA blendIDA onlyIDA totalIndiaIndonesiaIran, Islamic Rep.IraqIrelandIsraelItalyJamaicaJapanJordanKazakhstanKenyaKiribatiKorea, Rep.KuwaitKyrgyz RepublicLao PDRLate-demographic dividendLatin America & Caribbean Latin America & Caribbean (excluding high income)Latin America & the Caribbean (IDA & IBRD countries)LatviaLeast developed countries: UN classificationLebanonLesothoLiberiaLibyaLithuaniaLow & middle incomeLow incomeLower middle incomeLuxembourgMacao SAR, ChinaMacedonia, FYRMadagascarMalawiMalaysiaMaldivesMaliMaltaMauritaniaMauritiusMexicoMiddle East & North AfricaMiddle East & North Africa (excluding high income)Middle East & North Africa (IDA & IBRD countries)Middle incomeMoldovaMongoliaMoroccoMozambiqueMyanmarNamibiaNepalNetherlandsNew CaledoniaNew ZealandNicaraguaNigerNigeriaNorth AmericaNorwayOECD membersOmanOther small statesPacific island small statesPakistanPalauPanamaPapua New GuineaParaguayPeruPhilippinesPolandPortugalPost-demographic dividendPre-demographic dividendQatarRomaniaRussian FederationRwandaSamoaSao Tome and PrincipeSaudi ArabiaSenegalSerbiaSeychellesSierra LeoneSingaporeSlovak RepublicSloveniaSmall statesSolomon IslandsSomaliaSouth AfricaSouth AsiaSouth Asia (IDA & IBRD)SpainSri LankaSt. Kitts and NevisSt. LuciaSt. Vincent and the GrenadinesSub-Saharan Africa Sub-Saharan Africa (excluding high income)Sub-Saharan Africa (IDA & IBRD countries)SudanSurinameSwazilandSwedenSwitzerlandSyrian Arab RepublicTajikistanTanzaniaThailandTimor-LesteTogoTongaTrinidad and TobagoTunisiaTurkeyTurkmenistanTurks and Caicos IslandsTuvaluUgandaUkraineUnited Arab EmiratesUnited KingdomUnited StatesUpper middle incomeUruguayVanuatuVenezuela, RBVietnamVirgin Islands (U.S.)WorldYemen, Rep.ZambiaZimbabwe Timeline:
This timeline shows a graph from 1963 to 2016 of Chile. No data until 1962. Number of actual observations by date: 54.
Source name:
World Development Indicators
Source organization:
World Bank staff estimates from the Comtrade database maintained by the United Nations Statistics Division.
Categories, topics:
Private Sector, Trade
Last updated:
apr 23, 2017
Indicators value changes by year
Maximum:
32.661
jan 1, 1975
At the date of observation
Value
Absolute change
Change from previous value
jan 1, 1963
19.383
+19.383
0.0%
jan 1, 1964
21.437
+2.054
10.6%
jan 1, 1965
20.712
-0.725
-3.38%
jan 1, 1966
20.074
-0.638
-3.08%
jan 1, 1967
18.506
-1.568
-7.81%
jan 1, 1968
16.775
-1.731
-9.35%
jan 1, 1969
17.209
+0.434
2.59%
jan 1, 1970
16.971
-0.237
-1.38%
jan 1, 1971
14.639
-2.333
-13.75%
jan 1, 1972
17.735
+3.096
21.15%
jan 1, 1973
23.417
+5.682
32.04%
jan 1, 1974
25.819
+2.402
10.26%
jan 1, 1975
32.661
+6.842
26.5%
jan 1, 1976
18.534
-14.127
-43.25%
jan 1, 1977
25.574
+7.04
37.98%
jan 1, 1978
12.423
-13.151
-51.42%
jan 1, 1979
16.665
+4.242
34.15%
jan 1, 1980
12.701
-3.964
-23.79%
jan 1, 1981
15.028
+2.327
18.32%
jan 1, 1982
11.973
-3.055
-20.33%
jan 1, 1983
16.214
+4.241
35.42%
jan 1, 1984
17.976
+1.762
10.87%
jan 1, 1985
13.544
-4.432
-24.66%
jan 1, 1986
8.31
-5.234
-38.64%
jan 1, 1987
5.08
-3.231
-38.88%
jan 1, 1988
4.812
-0.268
-5.27%
jan 1, 1989
5.29
+0.478
9.93%
jan 1, 1990
3.58
-1.71
-32.33%
jan 1, 1991
4.383
+0.804
22.45%
jan 1, 1992
5.793
+1.41
32.17%
jan 1, 1993
6.315
+0.521
9.0%
jan 1, 1994
5.991
-0.323
-5.12%
jan 1, 1995
6.938
+0.946
15.79%
jan 1, 1996
6.718
-0.22
-3.17%
jan 1, 1997
7.164
+0.446
6.64%
jan 1, 1998
6.725
-0.439
-6.13%
jan 1, 1999
7.302
+0.577
8.58%
jan 1, 2000
8.61
+1.307
17.9%
jan 1, 2001
7.382
-1.227
-14.25%
jan 1, 2002
7.36
-0.022
-0.3%
jan 1, 2003
7.967
+0.607
8.24%
jan 1, 2004
7.734
-0.233
-2.92%
jan 1, 2005
6.905
-0.829
-10.72%
jan 1, 2006
5.806
-1.099
-15.91%
jan 1, 2007
6.184
+0.378
6.5%
jan 1, 2008
6.629
+0.445
7.19%
jan 1, 2009
6.765
+0.137
2.06%
jan 1, 2010
7.304
+0.539
7.96%
jan 1, 2011
7.072
-0.232
-3.17%
jan 1, 2012
7.379
+0.306
4.33%
jan 1, 2013
7.378
-0.001
-0.01%
jan 1, 2014
7.668
+0.29
3.93%
jan 1, 2015
8.433
+0.765
9.98%
jan 1, 2016
8.979
+0.546
6.47%
Ranking of countries by current statistics by years


Comments: