29
/
en
AIzaSyAYiBZKx7MnpbEhh9jyipgxe19OcubqV5w
April 1, 2024
133121
Finland
FIN
true
2
1
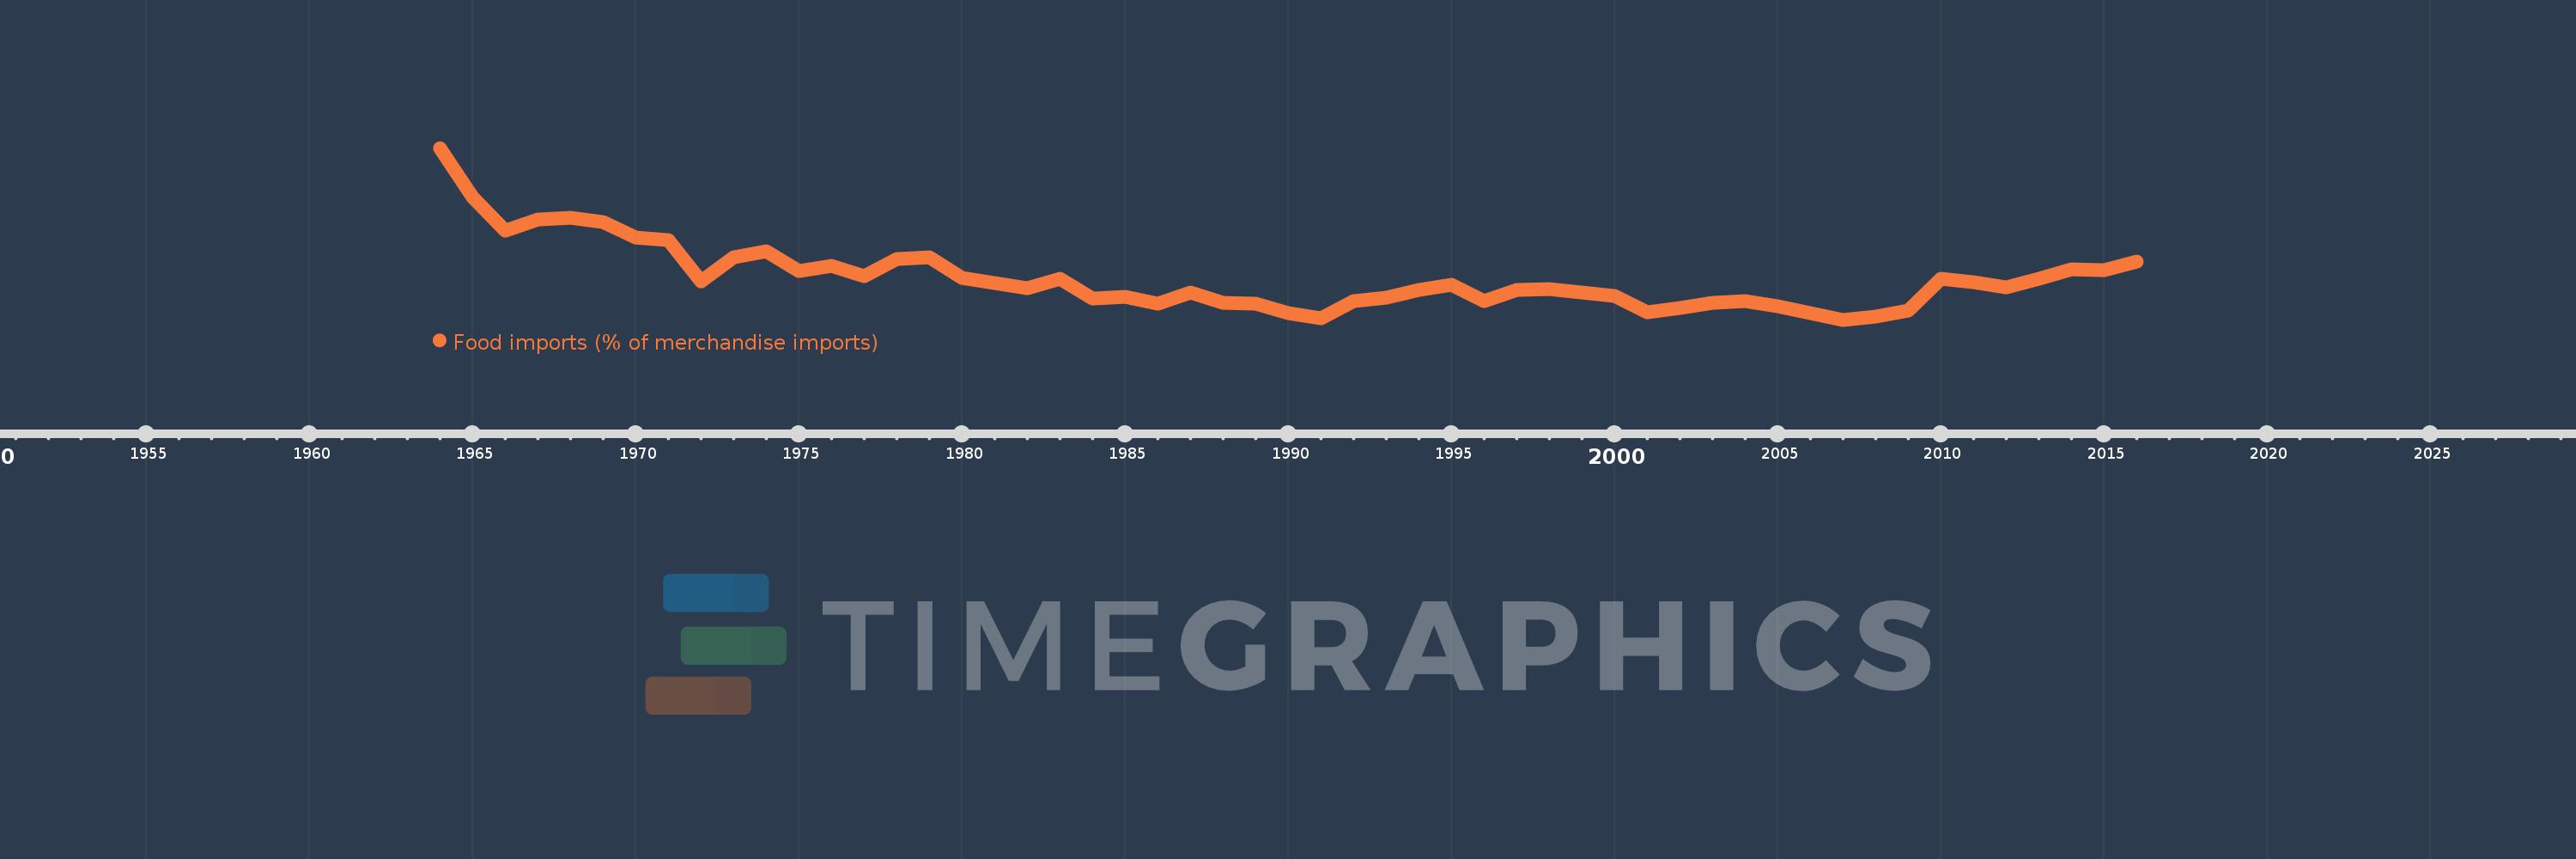
Food imports (% of merchandise imports)
2016,2015,2014,2013,2012,2011,2010,2009,2008,2007,2006,2005,2004,2003,2002,2001,2000,1999,1998,1997,1996,1995,1994,1993,1992,1991,1990,1989,1988,1987,1986,1985,1984,1983,1982,1981,1980,1979,1978,1977,1976,1975,1974,1973,1972,1971,1970,1969,1968,1967,1966,1965,1964
This statistics in other country:
AfghanistanAlbaniaAlgeriaAndorraAngolaAntigua and BarbudaArab WorldArgentinaArmeniaArubaAustraliaAustriaAzerbaijanBahamas, TheBahrainBangladeshBarbadosBelarusBelgiumBelizeBeninBermudaBhutanBoliviaBosnia and HerzegovinaBotswanaBrazilBrunei DarussalamBulgariaBurkina FasoBurundiCabo VerdeCambodiaCameroonCanadaCaribbean small statesCayman IslandsCentral African RepublicCentral Europe and the BalticsChadChileChinaColombiaComorosCongo, Dem. Rep.Congo, Rep.Costa RicaCote d'IvoireCroatiaCubaCyprusCzech RepublicDenmarkDjiboutiDominicaDominican RepublicEarly-demographic dividendEast Asia & PacificEast Asia & Pacific (excluding high income)East Asia & Pacific (IDA & IBRD countries)EcuadorEgypt, Arab Rep.El SalvadorEquatorial GuineaEritreaEstoniaEthiopiaEuro areaEurope & Central AsiaEurope & Central Asia (excluding high income)Europe & Central Asia (IDA & IBRD countries)European UnionFaroe IslandsFijiFinlandFragile and conflict affected situationsFranceFrench PolynesiaGabonGambia, TheGeorgiaGermanyGhanaGreeceGreenlandGrenadaGuatemalaGuineaGuinea-BissauGuyanaHaitiHeavily indebted poor countries (HIPC)High incomeHondurasHong Kong SAR, ChinaHungaryIBRD onlyIcelandIDA & IBRD totalIDA blendIDA onlyIDA totalIndiaIndonesiaIran, Islamic Rep.IraqIrelandIsraelItalyJamaicaJapanJordanKazakhstanKenyaKiribatiKorea, Rep.KuwaitKyrgyz RepublicLao PDRLate-demographic dividendLatin America & Caribbean Latin America & Caribbean (excluding high income)Latin America & the Caribbean (IDA & IBRD countries)LatviaLeast developed countries: UN classificationLebanonLesothoLiberiaLibyaLithuaniaLow & middle incomeLow incomeLower middle incomeLuxembourgMacao SAR, ChinaMacedonia, FYRMadagascarMalawiMalaysiaMaldivesMaliMaltaMauritaniaMauritiusMexicoMiddle East & North AfricaMiddle East & North Africa (excluding high income)Middle East & North Africa (IDA & IBRD countries)Middle incomeMoldovaMongoliaMoroccoMozambiqueMyanmarNamibiaNepalNetherlandsNew CaledoniaNew ZealandNicaraguaNigerNigeriaNorth AmericaNorwayOECD membersOmanOther small statesPacific island small statesPakistanPalauPanamaPapua New GuineaParaguayPeruPhilippinesPolandPortugalPost-demographic dividendPre-demographic dividendQatarRomaniaRussian FederationRwandaSamoaSao Tome and PrincipeSaudi ArabiaSenegalSerbiaSeychellesSierra LeoneSingaporeSlovak RepublicSloveniaSmall statesSolomon IslandsSomaliaSouth AfricaSouth AsiaSouth Asia (IDA & IBRD)SpainSri LankaSt. Kitts and NevisSt. LuciaSt. Vincent and the GrenadinesSub-Saharan Africa Sub-Saharan Africa (excluding high income)Sub-Saharan Africa (IDA & IBRD countries)SudanSurinameSwazilandSwedenSwitzerlandSyrian Arab RepublicTajikistanTanzaniaThailandTimor-LesteTogoTongaTrinidad and TobagoTunisiaTurkeyTurkmenistanTurks and Caicos IslandsTuvaluUgandaUkraineUnited Arab EmiratesUnited KingdomUnited StatesUpper middle incomeUruguayVanuatuVenezuela, RBVietnamVirgin Islands (U.S.)WorldYemen, Rep.ZambiaZimbabwe Timeline:
This timeline shows a graph from 1964 to 2016 of Finland. No data until 1963. Number of actual observations by date: 53.
Source name:
World Development Indicators
Source organization:
World Bank staff estimates from the Comtrade database maintained by the United Nations Statistics Division.
Categories, topics:
Private Sector, Trade
Last updated:
apr 23, 2017
Indicators value changes by year
Maximum:
15.609
jan 1, 1964
At the date of observation
Value
Absolute change
Change from previous value
jan 1, 1964
15.609
+15.609
0.0%
jan 1, 1965
12.51
-3.099
-19.85%
jan 1, 1966
10.372
-2.139
-17.1%
jan 1, 1967
11.099
+0.727
7.01%
jan 1, 1968
11.232
+0.133
1.2%
jan 1, 1969
10.95
-0.282
-2.51%
jan 1, 1970
9.965
-0.985
-8.99%
jan 1, 1971
9.822
-0.143
-1.43%
jan 1, 1972
7.207
-2.614
-26.62%
jan 1, 1973
8.707
+1.5
20.81%
jan 1, 1974
9.081
+0.374
4.3%
jan 1, 1975
7.836
-1.246
-13.72%
jan 1, 1976
8.19
+0.354
4.52%
jan 1, 1977
7.538
-0.652
-7.96%
jan 1, 1978
8.628
+1.09
14.45%
jan 1, 1979
8.695
+0.067
0.78%
jan 1, 1980
7.413
-1.282
-14.74%
jan 1, 1981
7.101
-0.312
-4.21%
jan 1, 1982
6.752
-0.349
-4.91%
jan 1, 1983
7.372
+0.62
9.18%
jan 1, 1984
6.116
-1.256
-17.04%
jan 1, 1985
6.225
+0.109
1.79%
jan 1, 1986
5.773
-0.452
-7.26%
jan 1, 1987
6.468
+0.695
12.05%
jan 1, 1988
5.857
-0.612
-9.46%
jan 1, 1989
5.775
-0.082
-1.39%
jan 1, 1990
5.202
-0.573
-9.93%
jan 1, 1991
4.88
-0.322
-6.18%
jan 1, 1992
5.954
+1.073
22.0%
jan 1, 1993
6.18
+0.226
3.8%
jan 1, 1994
6.668
+0.489
7.91%
jan 1, 1995
6.979
+0.311
4.66%
jan 1, 1996
5.953
-1.027
-14.71%
jan 1, 1997
6.664
+0.712
11.96%
jan 1, 1998
6.719
+0.055
0.82%
jan 1, 1999
6.502
-0.217
-3.24%
jan 1, 2000
6.268
-0.234
-3.6%
jan 1, 2001
5.222
-1.046
-16.69%
jan 1, 2002
5.522
+0.3
5.74%
jan 1, 2003
5.869
+0.348
6.3%
jan 1, 2004
5.972
+0.103
1.75%
jan 1, 2005
5.607
-0.366
-6.13%
jan 1, 2006
5.203
-0.403
-7.19%
jan 1, 2007
4.775
-0.429
-8.24%
jan 1, 2008
4.955
+0.18
3.78%
jan 1, 2009
5.357
+0.401
8.1%
jan 1, 2010
7.34
+1.983
37.02%
jan 1, 2011
7.135
-0.205
-2.8%
jan 1, 2012
6.798
-0.337
-4.72%
jan 1, 2013
7.364
+0.566
8.33%
jan 1, 2014
7.93
+0.566
7.68%
jan 1, 2015
7.903
-0.027
-0.34%
jan 1, 2016
8.419
+0.516
6.53%
Ranking of countries by current statistics by years


Comments: