29
/
en
AIzaSyAYiBZKx7MnpbEhh9jyipgxe19OcubqV5w
April 1, 2024
262221
Thailand
THA
true
2
1
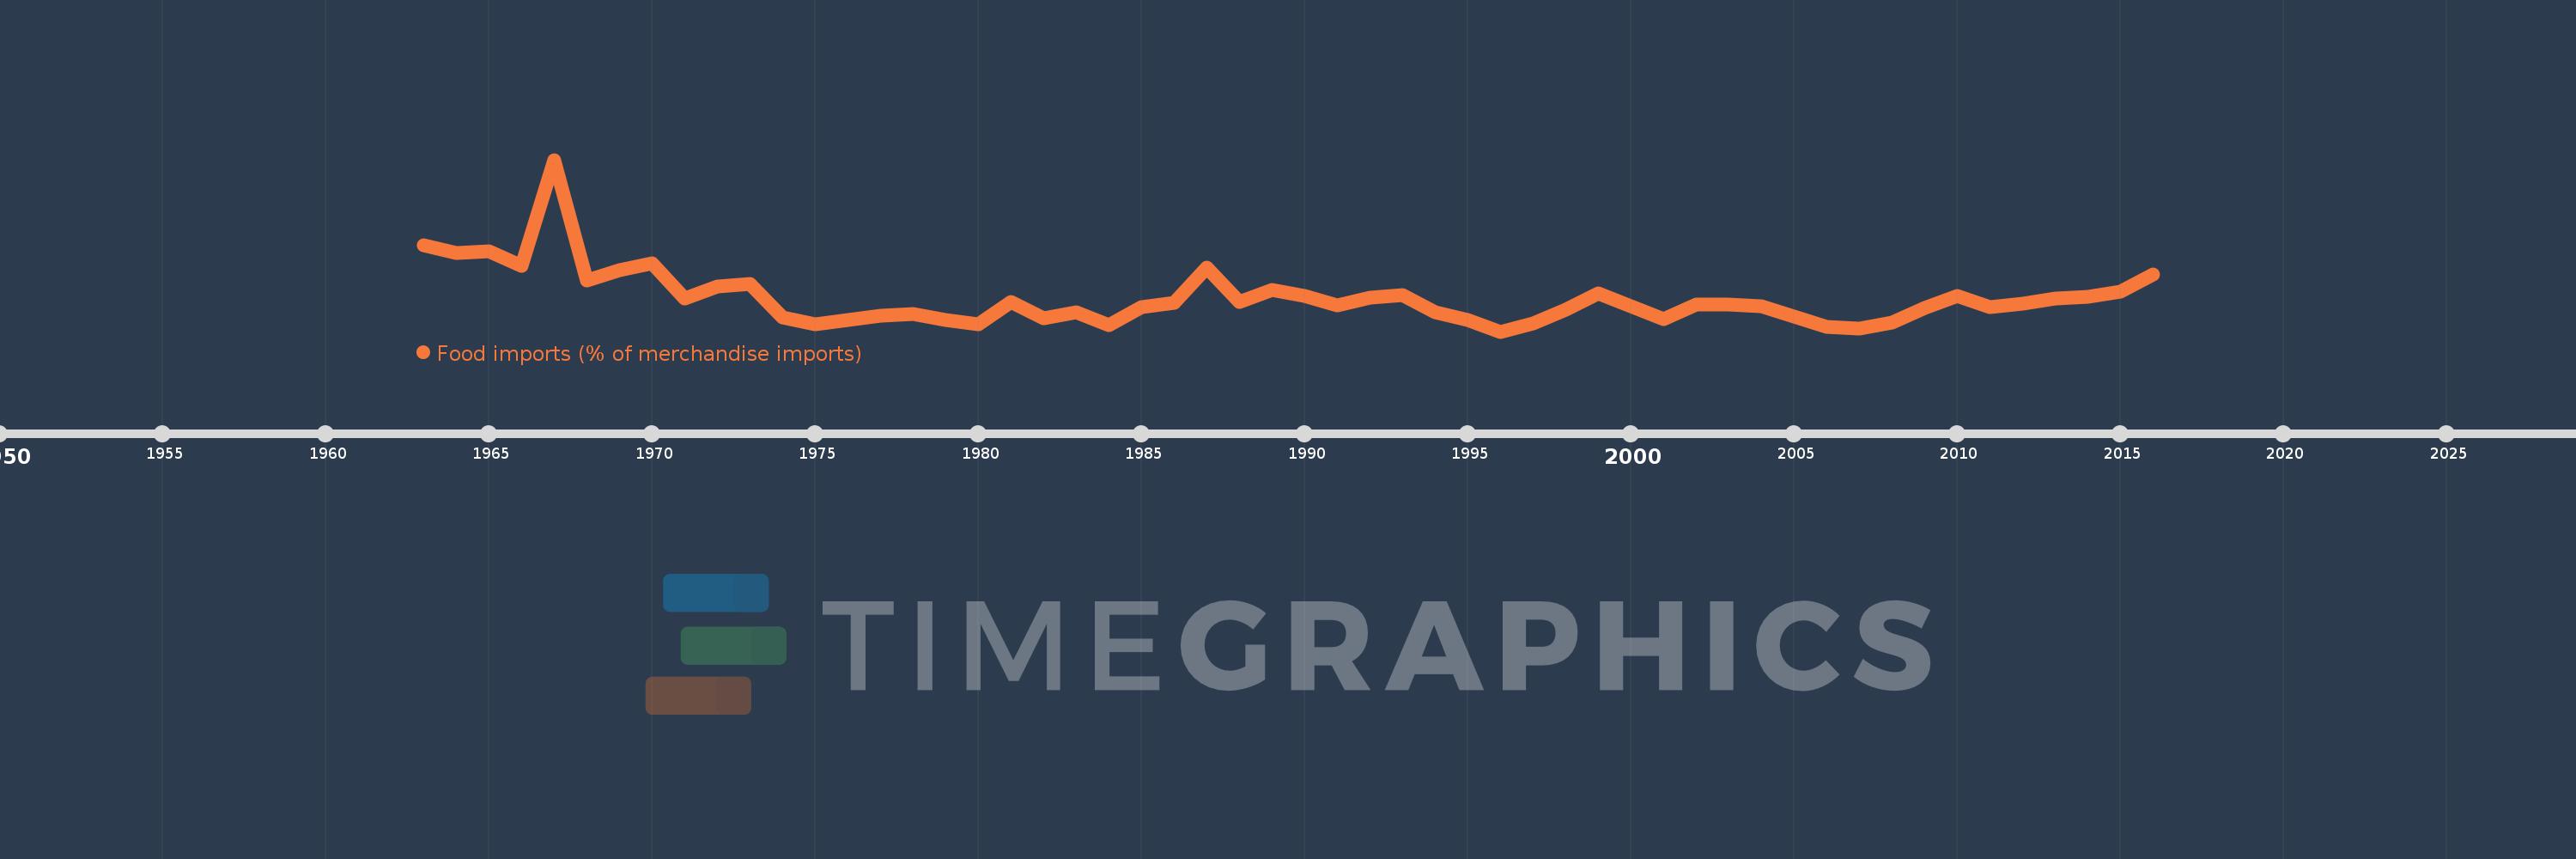
Food imports (% of merchandise imports)
2016,2015,2014,2013,2012,2011,2010,2009,2008,2007,2006,2005,2004,2003,2002,2001,2000,1999,1998,1997,1996,1995,1994,1993,1992,1991,1990,1989,1988,1987,1986,1985,1984,1983,1982,1981,1980,1979,1978,1977,1976,1975,1974,1973,1972,1971,1970,1969,1968,1967,1966,1965,1964,1963
This statistics in other country:
AfghanistanAlbaniaAlgeriaAndorraAngolaAntigua and BarbudaArab WorldArgentinaArmeniaArubaAustraliaAustriaAzerbaijanBahamas, TheBahrainBangladeshBarbadosBelarusBelgiumBelizeBeninBermudaBhutanBoliviaBosnia and HerzegovinaBotswanaBrazilBrunei DarussalamBulgariaBurkina FasoBurundiCabo VerdeCambodiaCameroonCanadaCaribbean small statesCayman IslandsCentral African RepublicCentral Europe and the BalticsChadChileChinaColombiaComorosCongo, Dem. Rep.Congo, Rep.Costa RicaCote d'IvoireCroatiaCubaCyprusCzech RepublicDenmarkDjiboutiDominicaDominican RepublicEarly-demographic dividendEast Asia & PacificEast Asia & Pacific (excluding high income)East Asia & Pacific (IDA & IBRD countries)EcuadorEgypt, Arab Rep.El SalvadorEquatorial GuineaEritreaEstoniaEthiopiaEuro areaEurope & Central AsiaEurope & Central Asia (excluding high income)Europe & Central Asia (IDA & IBRD countries)European UnionFaroe IslandsFijiFinlandFragile and conflict affected situationsFranceFrench PolynesiaGabonGambia, TheGeorgiaGermanyGhanaGreeceGreenlandGrenadaGuatemalaGuineaGuinea-BissauGuyanaHaitiHeavily indebted poor countries (HIPC)High incomeHondurasHong Kong SAR, ChinaHungaryIBRD onlyIcelandIDA & IBRD totalIDA blendIDA onlyIDA totalIndiaIndonesiaIran, Islamic Rep.IraqIrelandIsraelItalyJamaicaJapanJordanKazakhstanKenyaKiribatiKorea, Rep.KuwaitKyrgyz RepublicLao PDRLate-demographic dividendLatin America & Caribbean Latin America & Caribbean (excluding high income)Latin America & the Caribbean (IDA & IBRD countries)LatviaLeast developed countries: UN classificationLebanonLesothoLiberiaLibyaLithuaniaLow & middle incomeLow incomeLower middle incomeLuxembourgMacao SAR, ChinaMacedonia, FYRMadagascarMalawiMalaysiaMaldivesMaliMaltaMauritaniaMauritiusMexicoMiddle East & North AfricaMiddle East & North Africa (excluding high income)Middle East & North Africa (IDA & IBRD countries)Middle incomeMoldovaMongoliaMoroccoMozambiqueMyanmarNamibiaNepalNetherlandsNew CaledoniaNew ZealandNicaraguaNigerNigeriaNorth AmericaNorwayOECD membersOmanOther small statesPacific island small statesPakistanPalauPanamaPapua New GuineaParaguayPeruPhilippinesPolandPortugalPost-demographic dividendPre-demographic dividendQatarRomaniaRussian FederationRwandaSamoaSao Tome and PrincipeSaudi ArabiaSenegalSerbiaSeychellesSierra LeoneSingaporeSlovak RepublicSloveniaSmall statesSolomon IslandsSomaliaSouth AfricaSouth AsiaSouth Asia (IDA & IBRD)SpainSri LankaSt. Kitts and NevisSt. LuciaSt. Vincent and the GrenadinesSub-Saharan Africa Sub-Saharan Africa (excluding high income)Sub-Saharan Africa (IDA & IBRD countries)SudanSurinameSwazilandSwedenSwitzerlandSyrian Arab RepublicTajikistanTanzaniaThailandTimor-LesteTogoTongaTrinidad and TobagoTunisiaTurkeyTurkmenistanTurks and Caicos IslandsTuvaluUgandaUkraineUnited Arab EmiratesUnited KingdomUnited StatesUpper middle incomeUruguayVanuatuVenezuela, RBVietnamVirgin Islands (U.S.)WorldYemen, Rep.ZambiaZimbabwe Timeline:
This timeline shows a graph from 1963 to 2016 of Thailand. No data until 1962. Number of actual observations by date: 54.
Source name:
World Development Indicators
Source organization:
World Bank staff estimates from the Comtrade database maintained by the United Nations Statistics Division.
Categories, topics:
Private Sector, Trade
Last updated:
apr 23, 2017
Indicators value changes by year
Maximum:
12.087
jan 1, 1967
At the date of observation
Value
Absolute change
Change from previous value
jan 1, 1963
7.947
+7.947
0.0%
jan 1, 1964
7.598
-0.349
-4.4%
jan 1, 1965
7.68
+0.083
1.09%
jan 1, 1966
6.974
-0.706
-9.2%
jan 1, 1967
12.087
+5.113
73.32%
jan 1, 1968
6.236
-5.851
-48.41%
jan 1, 1969
6.759
+0.523
8.39%
jan 1, 1970
7.089
+0.33
4.89%
jan 1, 1971
5.393
-1.696
-23.93%
jan 1, 1972
5.98
+0.587
10.89%
jan 1, 1973
6.097
+0.117
1.95%
jan 1, 1974
4.487
-1.609
-26.4%
jan 1, 1975
4.12
-0.368
-8.19%
jan 1, 1976
4.34
+0.22
5.35%
jan 1, 1977
4.531
+0.191
4.4%
jan 1, 1978
4.63
+0.099
2.19%
jan 1, 1979
4.342
-0.288
-6.22%
jan 1, 1980
4.143
-0.2
-4.6%
jan 1, 1981
5.231
+1.089
26.28%
jan 1, 1982
4.414
-0.817
-15.62%
jan 1, 1983
4.722
+0.308
6.97%
jan 1, 1984
4.113
-0.609
-12.89%
jan 1, 1985
4.949
+0.837
20.34%
jan 1, 1986
5.175
+0.225
4.55%
jan 1, 1987
6.855
+1.68
32.47%
jan 1, 1988
5.207
-1.648
-24.04%
jan 1, 1989
5.775
+0.567
10.9%
jan 1, 1990
5.511
-0.263
-4.56%
jan 1, 1991
5.045
-0.466
-8.46%
jan 1, 1992
5.427
+0.382
7.57%
jan 1, 1993
5.545
+0.118
2.17%
jan 1, 1994
4.707
-0.838
-15.11%
jan 1, 1995
4.345
-0.362
-7.69%
jan 1, 1996
3.781
-0.564
-12.99%
jan 1, 1997
4.155
+0.374
9.9%
jan 1, 1998
4.846
+0.691
16.63%
jan 1, 1999
5.622
+0.776
16.02%
jan 1, 2000
5.004
-0.618
-10.98%
jan 1, 2001
4.402
-0.602
-12.03%
jan 1, 2002
5.077
+0.674
15.32%
jan 1, 2003
5.094
+0.017
0.34%
jan 1, 2004
4.991
-0.103
-2.02%
jan 1, 2005
4.525
-0.466
-9.33%
jan 1, 2006
4.013
-0.512
-11.32%
jan 1, 2007
3.945
-0.068
-1.7%
jan 1, 2008
4.209
+0.264
6.7%
jan 1, 2009
4.938
+0.729
17.31%
jan 1, 2010
5.503
+0.565
11.45%
jan 1, 2011
4.959
-0.544
-9.88%
jan 1, 2012
5.146
+0.187
3.76%
jan 1, 2013
5.362
+0.216
4.2%
jan 1, 2014
5.476
+0.114
2.13%
jan 1, 2015
5.724
+0.247
4.51%
jan 1, 2016
6.557
+0.834
14.57%
Ranking of countries by current statistics by years


Comments: