29
/
en
AIzaSyAYiBZKx7MnpbEhh9jyipgxe19OcubqV5w
April 1, 2024
222161
Peru
PER
true
2
1
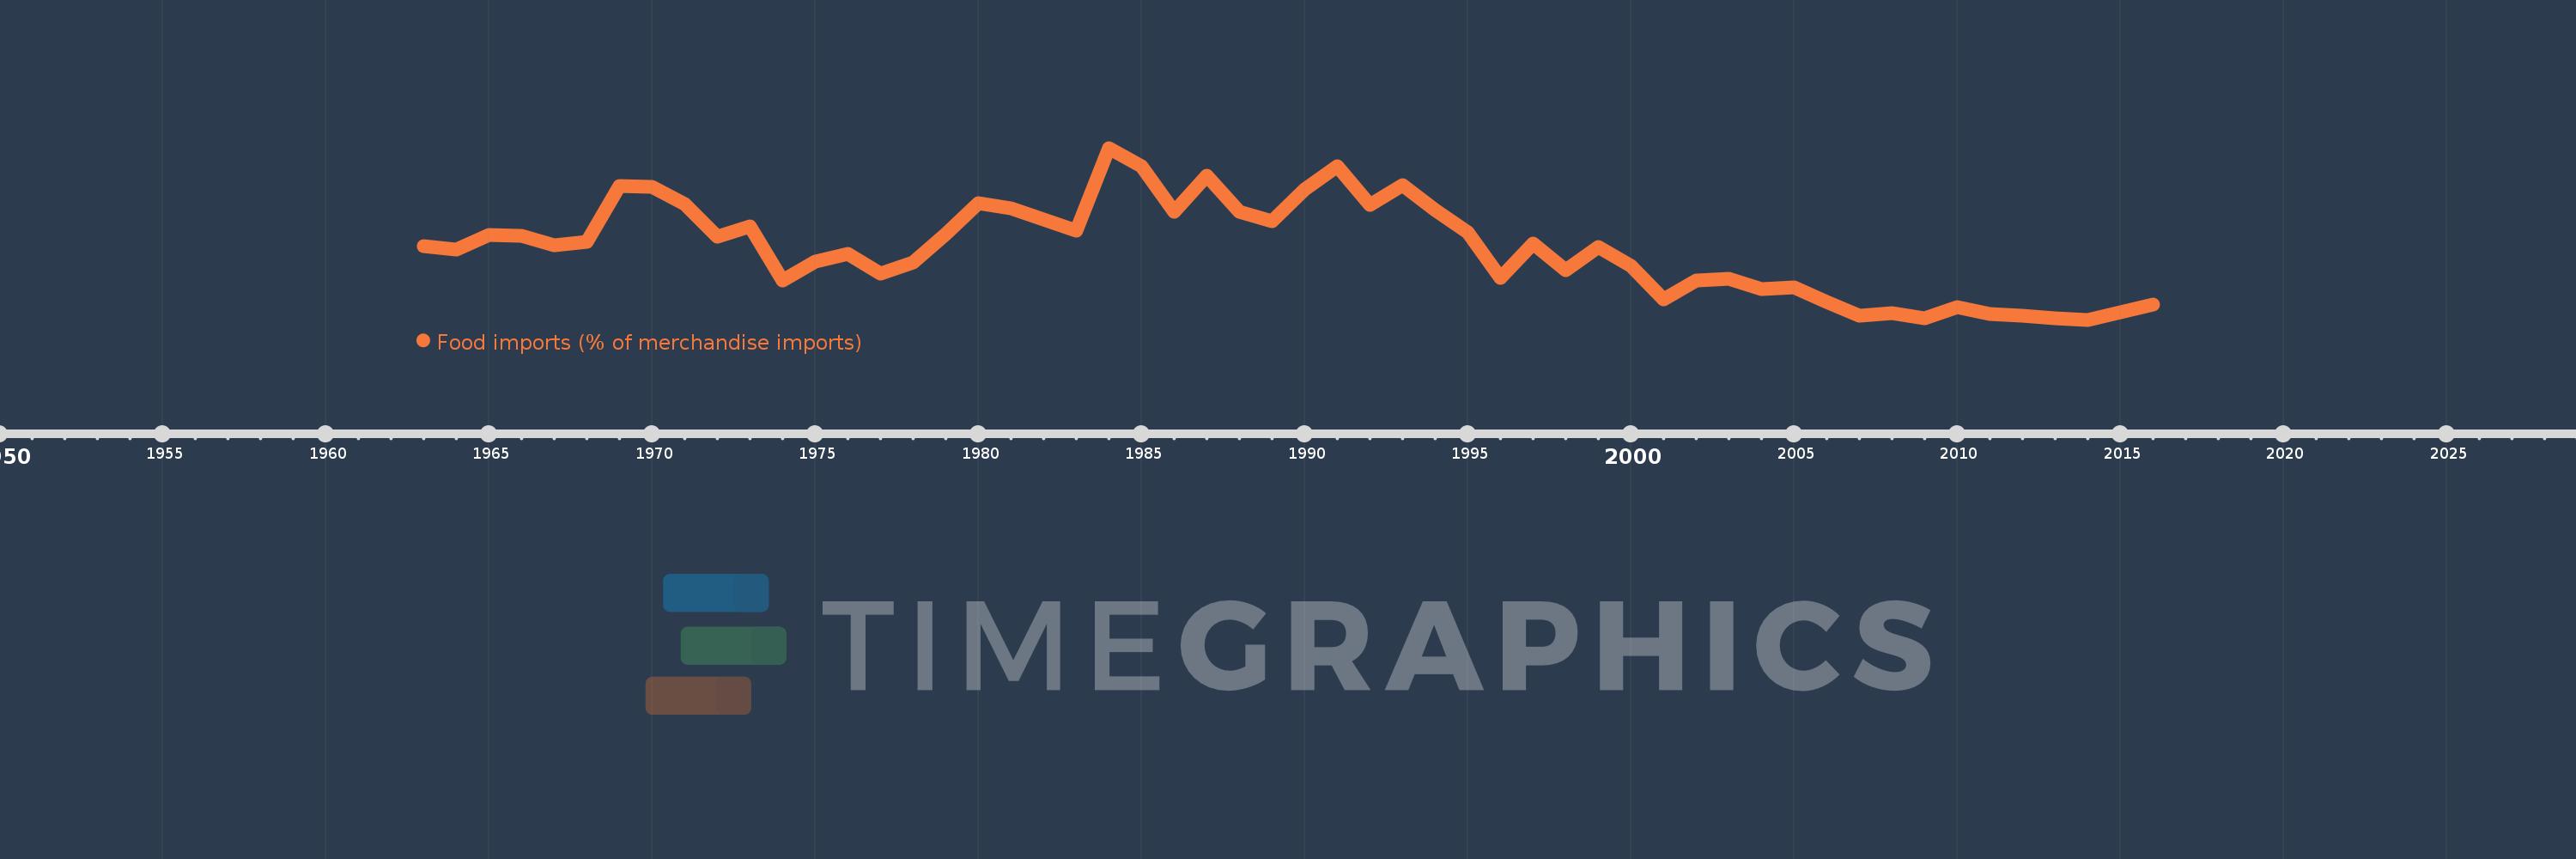
Food imports (% of merchandise imports)
2016,2015,2014,2013,2012,2011,2010,2009,2008,2007,2006,2005,2004,2003,2002,2001,2000,1999,1998,1997,1996,1995,1994,1993,1992,1991,1990,1989,1988,1987,1986,1985,1984,1983,1981,1980,1979,1978,1977,1976,1975,1974,1973,1972,1971,1970,1969,1968,1967,1966,1965,1964,1963
This statistics in other country:
AfghanistanAlbaniaAlgeriaAndorraAngolaAntigua and BarbudaArab WorldArgentinaArmeniaArubaAustraliaAustriaAzerbaijanBahamas, TheBahrainBangladeshBarbadosBelarusBelgiumBelizeBeninBermudaBhutanBoliviaBosnia and HerzegovinaBotswanaBrazilBrunei DarussalamBulgariaBurkina FasoBurundiCabo VerdeCambodiaCameroonCanadaCaribbean small statesCayman IslandsCentral African RepublicCentral Europe and the BalticsChadChileChinaColombiaComorosCongo, Dem. Rep.Congo, Rep.Costa RicaCote d'IvoireCroatiaCubaCyprusCzech RepublicDenmarkDjiboutiDominicaDominican RepublicEarly-demographic dividendEast Asia & PacificEast Asia & Pacific (excluding high income)East Asia & Pacific (IDA & IBRD countries)EcuadorEgypt, Arab Rep.El SalvadorEquatorial GuineaEritreaEstoniaEthiopiaEuro areaEurope & Central AsiaEurope & Central Asia (excluding high income)Europe & Central Asia (IDA & IBRD countries)European UnionFaroe IslandsFijiFinlandFragile and conflict affected situationsFranceFrench PolynesiaGabonGambia, TheGeorgiaGermanyGhanaGreeceGreenlandGrenadaGuatemalaGuineaGuinea-BissauGuyanaHaitiHeavily indebted poor countries (HIPC)High incomeHondurasHong Kong SAR, ChinaHungaryIBRD onlyIcelandIDA & IBRD totalIDA blendIDA onlyIDA totalIndiaIndonesiaIran, Islamic Rep.IraqIrelandIsraelItalyJamaicaJapanJordanKazakhstanKenyaKiribatiKorea, Rep.KuwaitKyrgyz RepublicLao PDRLate-demographic dividendLatin America & Caribbean Latin America & Caribbean (excluding high income)Latin America & the Caribbean (IDA & IBRD countries)LatviaLeast developed countries: UN classificationLebanonLesothoLiberiaLibyaLithuaniaLow & middle incomeLow incomeLower middle incomeLuxembourgMacao SAR, ChinaMacedonia, FYRMadagascarMalawiMalaysiaMaldivesMaliMaltaMauritaniaMauritiusMexicoMiddle East & North AfricaMiddle East & North Africa (excluding high income)Middle East & North Africa (IDA & IBRD countries)Middle incomeMoldovaMongoliaMoroccoMozambiqueMyanmarNamibiaNepalNetherlandsNew CaledoniaNew ZealandNicaraguaNigerNigeriaNorth AmericaNorwayOECD membersOmanOther small statesPacific island small statesPakistanPalauPanamaPapua New GuineaParaguayPeruPhilippinesPolandPortugalPost-demographic dividendPre-demographic dividendQatarRomaniaRussian FederationRwandaSamoaSao Tome and PrincipeSaudi ArabiaSenegalSerbiaSeychellesSierra LeoneSingaporeSlovak RepublicSloveniaSmall statesSolomon IslandsSomaliaSouth AfricaSouth AsiaSouth Asia (IDA & IBRD)SpainSri LankaSt. Kitts and NevisSt. LuciaSt. Vincent and the GrenadinesSub-Saharan Africa Sub-Saharan Africa (excluding high income)Sub-Saharan Africa (IDA & IBRD countries)SudanSurinameSwazilandSwedenSwitzerlandSyrian Arab RepublicTajikistanTanzaniaThailandTimor-LesteTogoTongaTrinidad and TobagoTunisiaTurkeyTurkmenistanTurks and Caicos IslandsTuvaluUgandaUkraineUnited Arab EmiratesUnited KingdomUnited StatesUpper middle incomeUruguayVanuatuVenezuela, RBVietnamVirgin Islands (U.S.)WorldYemen, Rep.ZambiaZimbabwe Timeline:
This timeline shows a graph from 1963 to 2016 of Peru. No data until 1962. Number of actual observations by date: 53.
Source name:
World Development Indicators
Source organization:
World Bank staff estimates from the Comtrade database maintained by the United Nations Statistics Division.
Categories, topics:
Private Sector, Trade
Last updated:
apr 23, 2017
Indicators value changes by year
Maximum:
25.165
jan 1, 1984
At the date of observation
Value
Absolute change
Change from previous value
jan 1, 1963
16.438
+16.438
0.0%
jan 1, 1964
16.092
-0.346
-2.11%
jan 1, 1965
17.386
+1.294
8.04%
jan 1, 1966
17.295
-0.091
-0.52%
jan 1, 1967
16.469
-0.825
-4.77%
jan 1, 1968
16.782
+0.313
1.9%
jan 1, 1969
21.786
+5.004
29.82%
jan 1, 1970
21.723
-0.063
-0.29%
jan 1, 1971
20.139
-1.584
-7.29%
jan 1, 1972
17.272
-2.867
-14.24%
jan 1, 1973
18.172
+0.9
5.21%
jan 1, 1974
13.367
-4.805
-26.44%
jan 1, 1975
15.053
+1.686
12.62%
jan 1, 1976
15.754
+0.701
4.66%
jan 1, 1977
13.968
-1.786
-11.34%
jan 1, 1978
14.95
+0.982
7.03%
jan 1, 1979
17.455
+2.506
16.76%
jan 1, 1980
20.246
+2.79
15.98%
jan 1, 1981
19.768
-0.478
-2.36%
jan 1, 1983
17.774
-1.993
-10.08%
jan 1, 1984
25.165
+7.391
41.58%
jan 1, 1985
23.536
-1.629
-6.47%
jan 1, 1986
19.451
-4.085
-17.36%
jan 1, 1987
22.712
+3.262
16.77%
jan 1, 1988
19.466
-3.246
-14.29%
jan 1, 1989
18.662
-0.805
-4.13%
jan 1, 1990
21.432
+2.77
14.84%
jan 1, 1991
23.566
+2.134
9.96%
jan 1, 1992
20.087
-3.478
-14.76%
jan 1, 1993
21.866
+1.779
8.86%
jan 1, 1994
19.643
-2.223
-10.17%
jan 1, 1995
17.625
-2.018
-10.27%
jan 1, 1996
13.549
-4.077
-23.13%
jan 1, 1997
16.614
+3.065
22.62%
jan 1, 1998
14.23
-2.384
-14.35%
jan 1, 1999
16.301
+2.071
14.56%
jan 1, 2000
14.674
-1.627
-9.98%
jan 1, 2001
11.649
-3.025
-20.62%
jan 1, 2002
13.328
+1.679
14.42%
jan 1, 2003
13.468
+0.14
1.05%
jan 1, 2004
12.58
-0.888
-6.59%
jan 1, 2005
12.709
+0.129
1.02%
jan 1, 2006
11.444
-1.265
-9.95%
jan 1, 2007
10.215
-1.23
-10.75%
jan 1, 2008
10.433
+0.219
2.14%
jan 1, 2009
9.983
-0.451
-4.32%
jan 1, 2010
10.998
+1.015
10.17%
jan 1, 2011
10.327
-0.671
-6.1%
jan 1, 2012
10.177
-0.15
-1.45%
jan 1, 2013
10.006
-0.171
-1.68%
jan 1, 2014
9.849
-0.157
-1.57%
jan 1, 2015
10.516
+0.667
6.77%
jan 1, 2016
11.217
+0.701
6.67%
Ranking of countries by current statistics by years


Comments: