29
/
en
AIzaSyAYiBZKx7MnpbEhh9jyipgxe19OcubqV5w
April 1, 2024
102416
Central African Republic
CAF
true
2
1
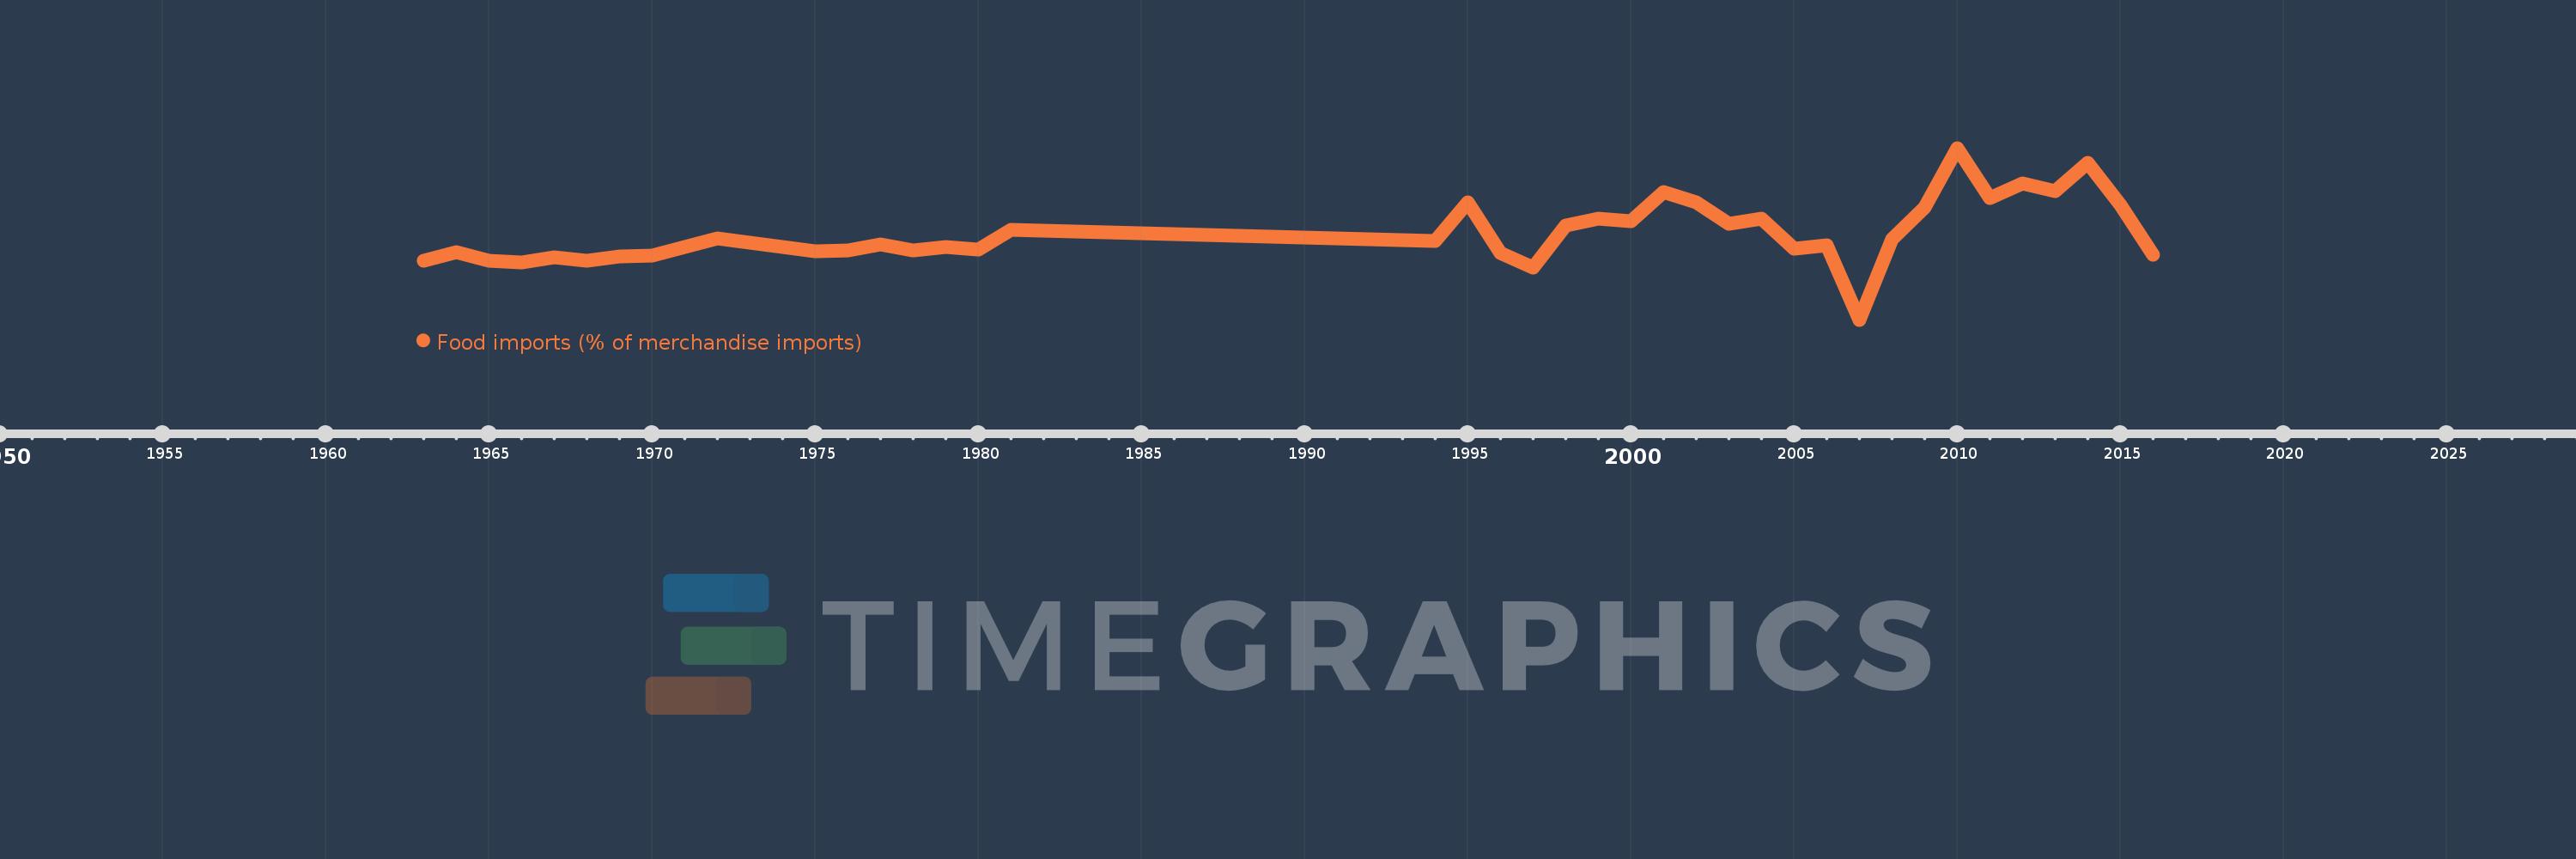
Food imports (% of merchandise imports)
2016,2015,2014,2013,2012,2011,2010,2009,2008,2007,2006,2005,2004,2003,2002,2001,2000,1999,1998,1997,1996,1995,1994,1990,1981,1980,1979,1978,1977,1976,1975,1974,1972,1971,1970,1969,1968,1967,1966,1965,1964,1963
This statistics in other country:
AfghanistanAlbaniaAlgeriaAndorraAngolaAntigua and BarbudaArab WorldArgentinaArmeniaArubaAustraliaAustriaAzerbaijanBahamas, TheBahrainBangladeshBarbadosBelarusBelgiumBelizeBeninBermudaBhutanBoliviaBosnia and HerzegovinaBotswanaBrazilBrunei DarussalamBulgariaBurkina FasoBurundiCabo VerdeCambodiaCameroonCanadaCaribbean small statesCayman IslandsCentral African RepublicCentral Europe and the BalticsChadChileChinaColombiaComorosCongo, Dem. Rep.Congo, Rep.Costa RicaCote d'IvoireCroatiaCubaCyprusCzech RepublicDenmarkDjiboutiDominicaDominican RepublicEarly-demographic dividendEast Asia & PacificEast Asia & Pacific (excluding high income)East Asia & Pacific (IDA & IBRD countries)EcuadorEgypt, Arab Rep.El SalvadorEquatorial GuineaEritreaEstoniaEthiopiaEuro areaEurope & Central AsiaEurope & Central Asia (excluding high income)Europe & Central Asia (IDA & IBRD countries)European UnionFaroe IslandsFijiFinlandFragile and conflict affected situationsFranceFrench PolynesiaGabonGambia, TheGeorgiaGermanyGhanaGreeceGreenlandGrenadaGuatemalaGuineaGuinea-BissauGuyanaHaitiHeavily indebted poor countries (HIPC)High incomeHondurasHong Kong SAR, ChinaHungaryIBRD onlyIcelandIDA & IBRD totalIDA blendIDA onlyIDA totalIndiaIndonesiaIran, Islamic Rep.IraqIrelandIsraelItalyJamaicaJapanJordanKazakhstanKenyaKiribatiKorea, Rep.KuwaitKyrgyz RepublicLao PDRLate-demographic dividendLatin America & Caribbean Latin America & Caribbean (excluding high income)Latin America & the Caribbean (IDA & IBRD countries)LatviaLeast developed countries: UN classificationLebanonLesothoLiberiaLibyaLithuaniaLow & middle incomeLow incomeLower middle incomeLuxembourgMacao SAR, ChinaMacedonia, FYRMadagascarMalawiMalaysiaMaldivesMaliMaltaMauritaniaMauritiusMexicoMiddle East & North AfricaMiddle East & North Africa (excluding high income)Middle East & North Africa (IDA & IBRD countries)Middle incomeMoldovaMongoliaMoroccoMozambiqueMyanmarNamibiaNepalNetherlandsNew CaledoniaNew ZealandNicaraguaNigerNigeriaNorth AmericaNorwayOECD membersOmanOther small statesPacific island small statesPakistanPalauPanamaPapua New GuineaParaguayPeruPhilippinesPolandPortugalPost-demographic dividendPre-demographic dividendQatarRomaniaRussian FederationRwandaSamoaSao Tome and PrincipeSaudi ArabiaSenegalSerbiaSeychellesSierra LeoneSingaporeSlovak RepublicSloveniaSmall statesSolomon IslandsSomaliaSouth AfricaSouth AsiaSouth Asia (IDA & IBRD)SpainSri LankaSt. Kitts and NevisSt. LuciaSt. Vincent and the GrenadinesSub-Saharan Africa Sub-Saharan Africa (excluding high income)Sub-Saharan Africa (IDA & IBRD countries)SudanSurinameSwazilandSwedenSwitzerlandSyrian Arab RepublicTajikistanTanzaniaThailandTimor-LesteTogoTongaTrinidad and TobagoTunisiaTurkeyTurkmenistanTurks and Caicos IslandsTuvaluUgandaUkraineUnited Arab EmiratesUnited KingdomUnited StatesUpper middle incomeUruguayVanuatuVenezuela, RBVietnamVirgin Islands (U.S.)WorldYemen, Rep.ZambiaZimbabwe Timeline:
This timeline shows a graph from 1963 to 2016 of Central African Republic. No data until 1962. Number of actual observations by date: 42.
Source name:
World Development Indicators
Source organization:
World Bank staff estimates from the Comtrade database maintained by the United Nations Statistics Division.
Categories, topics:
Private Sector, Trade
Last updated:
apr 23, 2017
Indicators value changes by year
Maximum:
39.328
jan 1, 2010
At the date of observation
Value
Absolute change
Change from previous value
jan 1, 1963
13.872
+13.872
0.0%
jan 1, 1964
15.756
+1.883
13.58%
jan 1, 1965
13.74
-2.015
-12.79%
jan 1, 1966
13.423
-0.317
-2.31%
jan 1, 1967
14.667
+1.244
9.26%
jan 1, 1968
13.779
-0.888
-6.06%
jan 1, 1969
14.809
+1.031
7.48%
jan 1, 1970
15.035
+0.225
1.52%
jan 1, 1971
16.936
+1.902
12.65%
jan 1, 1972
18.957
+2.021
11.93%
jan 1, 1974
16.848
-2.109
-11.13%
jan 1, 1975
15.993
-0.855
-5.07%
jan 1, 1976
16.12
+0.126
0.79%
jan 1, 1977
17.422
+1.302
8.08%
jan 1, 1978
16.074
-1.347
-7.73%
jan 1, 1979
16.894
+0.819
5.1%
jan 1, 1980
16.289
-0.605
-3.58%
jan 1, 1981
20.855
+4.566
28.03%
jan 1, 1990
19.131
-1.725
-8.27%
jan 1, 1994
18.304
-0.827
-4.32%
jan 1, 1995
27.084
+8.78
47.97%
jan 1, 1996
15.616
-11.467
-42.34%
jan 1, 1997
12.337
-3.279
-21.0%
jan 1, 1998
21.775
+9.438
76.5%
jan 1, 1999
23.415
+1.64
7.53%
jan 1, 2000
22.794
-0.621
-2.65%
jan 1, 2001
29.343
+6.549
28.73%
jan 1, 2002
26.954
-2.389
-8.14%
jan 1, 2003
22.202
-4.752
-17.63%
jan 1, 2004
23.419
+1.217
5.48%
jan 1, 2005
16.483
-6.936
-29.62%
jan 1, 2006
17.232
+0.749
4.54%
jan 1, 2007
0.474
-16.758
-97.25%
jan 1, 2008
18.612
+18.138
3.83K%
jan 1, 2009
25.93
+7.318
39.32%
jan 1, 2010
39.328
+13.398
51.67%
jan 1, 2011
28.092
-11.236
-28.57%
jan 1, 2012
31.236
+3.144
11.19%
jan 1, 2013
29.618
-1.618
-5.18%
jan 1, 2014
36.037
+6.419
21.67%
jan 1, 2015
26.365
-9.672
-26.84%
jan 1, 2016
15.161
-11.204
-42.49%
Ranking of countries by current statistics by years


Comments: