29
/
en
AIzaSyAYiBZKx7MnpbEhh9jyipgxe19OcubqV5w
April 1, 2024
126155
El Salvador
SLV
true
2
1
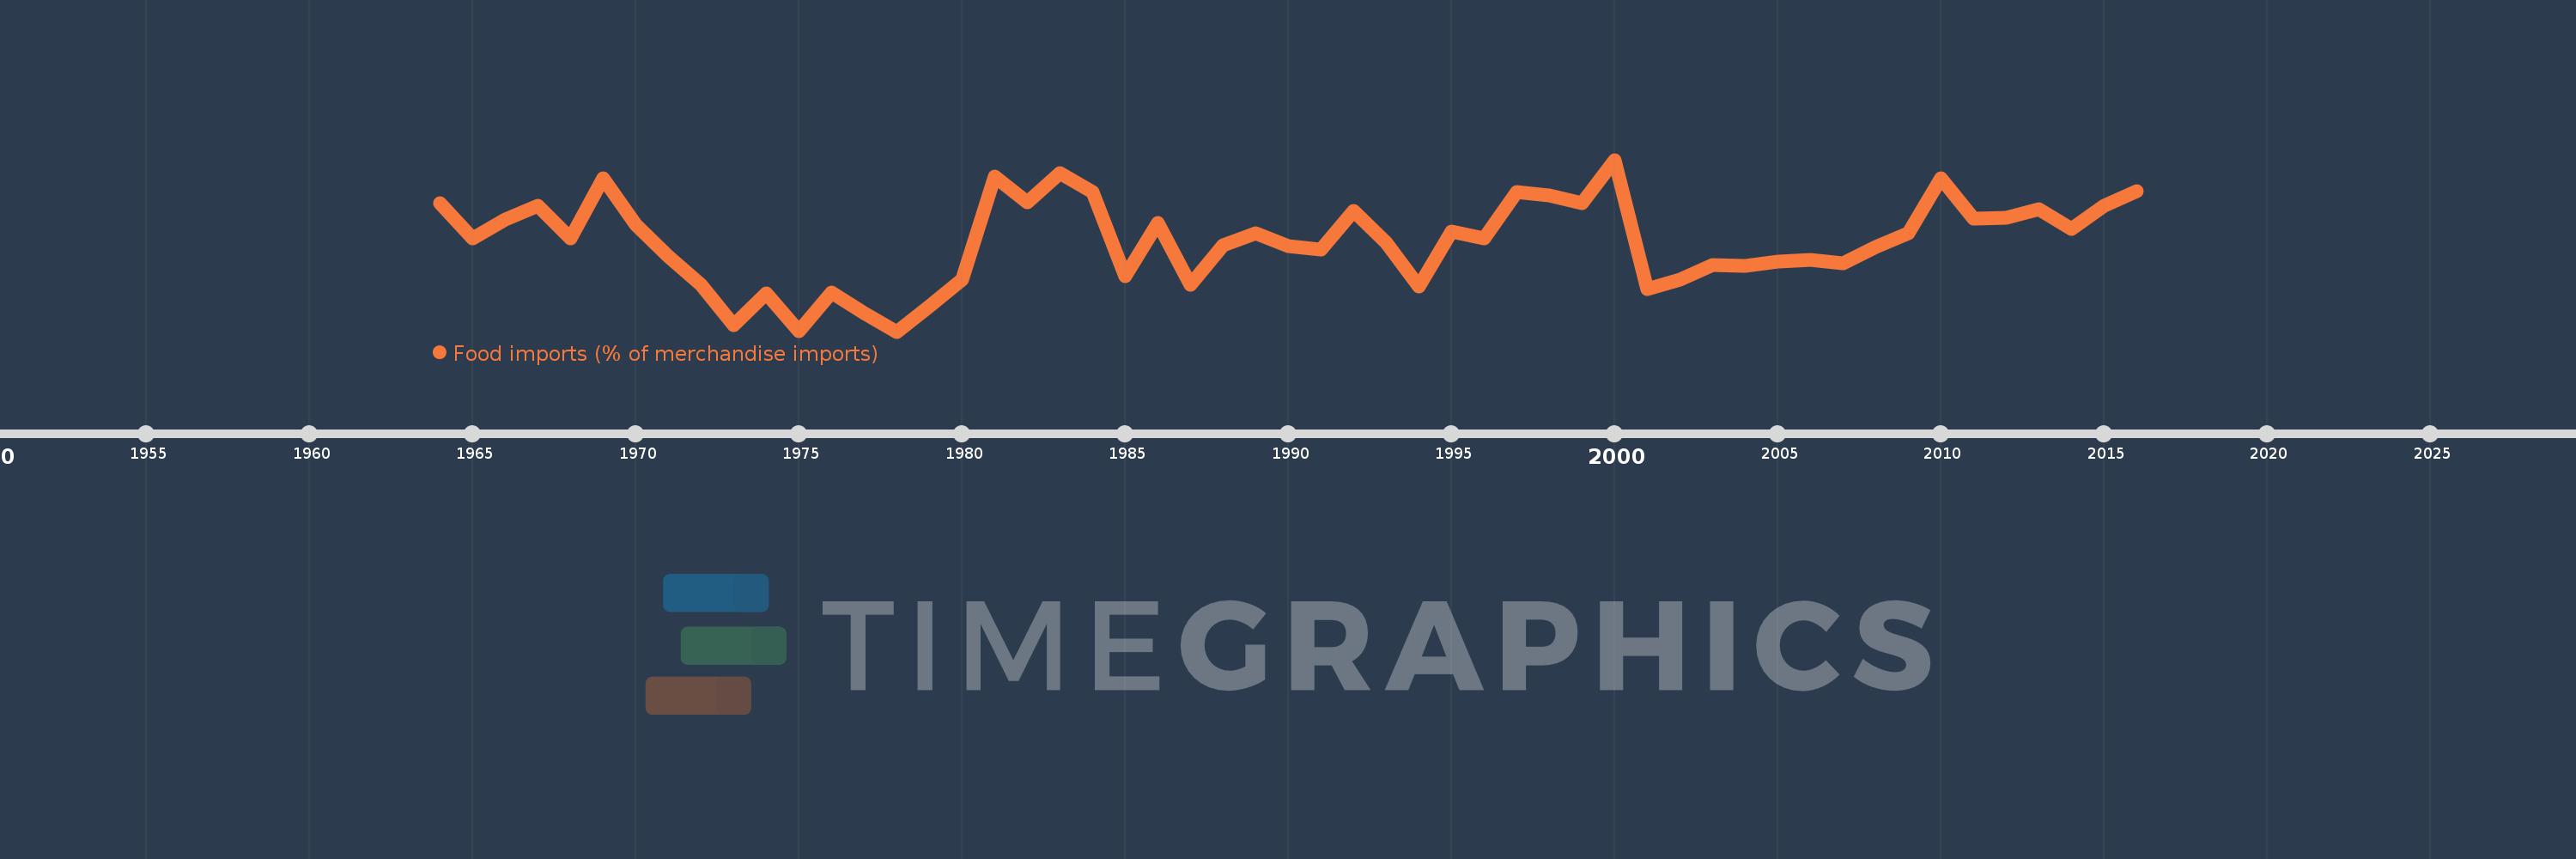
Food imports (% of merchandise imports)
2016,2015,2014,2013,2012,2011,2010,2009,2008,2007,2006,2005,2004,2003,2002,2001,2000,1999,1998,1997,1996,1995,1994,1993,1992,1991,1990,1989,1988,1987,1986,1985,1984,1983,1982,1981,1980,1979,1978,1977,1976,1975,1974,1973,1972,1971,1970,1969,1968,1967,1966,1965,1964
This statistics in other country:
AfghanistanAlbaniaAlgeriaAndorraAngolaAntigua and BarbudaArab WorldArgentinaArmeniaArubaAustraliaAustriaAzerbaijanBahamas, TheBahrainBangladeshBarbadosBelarusBelgiumBelizeBeninBermudaBhutanBoliviaBosnia and HerzegovinaBotswanaBrazilBrunei DarussalamBulgariaBurkina FasoBurundiCabo VerdeCambodiaCameroonCanadaCaribbean small statesCayman IslandsCentral African RepublicCentral Europe and the BalticsChadChileChinaColombiaComorosCongo, Dem. Rep.Congo, Rep.Costa RicaCote d'IvoireCroatiaCubaCyprusCzech RepublicDenmarkDjiboutiDominicaDominican RepublicEarly-demographic dividendEast Asia & PacificEast Asia & Pacific (excluding high income)East Asia & Pacific (IDA & IBRD countries)EcuadorEgypt, Arab Rep.El SalvadorEquatorial GuineaEritreaEstoniaEthiopiaEuro areaEurope & Central AsiaEurope & Central Asia (excluding high income)Europe & Central Asia (IDA & IBRD countries)European UnionFaroe IslandsFijiFinlandFragile and conflict affected situationsFranceFrench PolynesiaGabonGambia, TheGeorgiaGermanyGhanaGreeceGreenlandGrenadaGuatemalaGuineaGuinea-BissauGuyanaHaitiHeavily indebted poor countries (HIPC)High incomeHondurasHong Kong SAR, ChinaHungaryIBRD onlyIcelandIDA & IBRD totalIDA blendIDA onlyIDA totalIndiaIndonesiaIran, Islamic Rep.IraqIrelandIsraelItalyJamaicaJapanJordanKazakhstanKenyaKiribatiKorea, Rep.KuwaitKyrgyz RepublicLao PDRLate-demographic dividendLatin America & Caribbean Latin America & Caribbean (excluding high income)Latin America & the Caribbean (IDA & IBRD countries)LatviaLeast developed countries: UN classificationLebanonLesothoLiberiaLibyaLithuaniaLow & middle incomeLow incomeLower middle incomeLuxembourgMacao SAR, ChinaMacedonia, FYRMadagascarMalawiMalaysiaMaldivesMaliMaltaMauritaniaMauritiusMexicoMiddle East & North AfricaMiddle East & North Africa (excluding high income)Middle East & North Africa (IDA & IBRD countries)Middle incomeMoldovaMongoliaMoroccoMozambiqueMyanmarNamibiaNepalNetherlandsNew CaledoniaNew ZealandNicaraguaNigerNigeriaNorth AmericaNorwayOECD membersOmanOther small statesPacific island small statesPakistanPalauPanamaPapua New GuineaParaguayPeruPhilippinesPolandPortugalPost-demographic dividendPre-demographic dividendQatarRomaniaRussian FederationRwandaSamoaSao Tome and PrincipeSaudi ArabiaSenegalSerbiaSeychellesSierra LeoneSingaporeSlovak RepublicSloveniaSmall statesSolomon IslandsSomaliaSouth AfricaSouth AsiaSouth Asia (IDA & IBRD)SpainSri LankaSt. Kitts and NevisSt. LuciaSt. Vincent and the GrenadinesSub-Saharan Africa Sub-Saharan Africa (excluding high income)Sub-Saharan Africa (IDA & IBRD countries)SudanSurinameSwazilandSwedenSwitzerlandSyrian Arab RepublicTajikistanTanzaniaThailandTimor-LesteTogoTongaTrinidad and TobagoTunisiaTurkeyTurkmenistanTurks and Caicos IslandsTuvaluUgandaUkraineUnited Arab EmiratesUnited KingdomUnited StatesUpper middle incomeUruguayVanuatuVenezuela, RBVietnamVirgin Islands (U.S.)WorldYemen, Rep.ZambiaZimbabwe Timeline:
This timeline shows a graph from 1964 to 2016 of El Salvador. No data until 1963. Number of actual observations by date: 53.
Source name:
World Development Indicators
Source organization:
World Bank staff estimates from the Comtrade database maintained by the United Nations Statistics Division.
Categories, topics:
Private Sector, Trade
Last updated:
apr 23, 2017
Indicators value changes by year
Minimum:
10.314
jan 1, 1978
Maximum:
18.527
jan 1, 2000
At the date of observation
Value
Absolute change
Change from previous value
jan 1, 1964
16.436
+16.436
0.0%
jan 1, 1965
14.786
-1.65
-10.04%
jan 1, 1966
15.657
+0.871
5.89%
jan 1, 1967
16.319
+0.661
4.22%
jan 1, 1968
14.758
-1.561
-9.56%
jan 1, 1969
17.628
+2.87
19.45%
jan 1, 1970
15.447
-2.181
-12.37%
jan 1, 1971
13.909
-1.538
-9.96%
jan 1, 1972
12.566
-1.343
-9.66%
jan 1, 1973
10.64
-1.926
-15.33%
jan 1, 1974
12.153
+1.513
14.22%
jan 1, 1975
10.342
-1.811
-14.9%
jan 1, 1976
12.176
+1.834
17.73%
jan 1, 1977
11.192
-0.984
-8.08%
jan 1, 1978
10.314
-0.878
-7.84%
jan 1, 1979
11.519
+1.205
11.68%
jan 1, 1980
12.796
+1.277
11.08%
jan 1, 1981
17.733
+4.937
38.58%
jan 1, 1982
16.484
-1.249
-7.04%
jan 1, 1983
17.888
+1.405
8.52%
jan 1, 1984
16.998
-0.891
-4.98%
jan 1, 1985
12.971
-4.027
-23.69%
jan 1, 1986
15.513
+2.543
19.6%
jan 1, 1987
12.553
-2.96
-19.08%
jan 1, 1988
14.434
+1.88
14.98%
jan 1, 1989
15.03
+0.596
4.13%
jan 1, 1990
14.4
-0.629
-4.19%
jan 1, 1991
14.249
-0.151
-1.05%
jan 1, 1992
16.086
+1.836
12.89%
jan 1, 1993
14.551
-1.535
-9.54%
jan 1, 1994
12.477
-2.075
-14.26%
jan 1, 1995
15.1
+2.623
21.03%
jan 1, 1996
14.759
-0.341
-2.26%
jan 1, 1997
16.992
+2.233
15.13%
jan 1, 1998
16.82
-0.173
-1.02%
jan 1, 1999
16.457
-0.362
-2.15%
jan 1, 2000
18.527
+2.07
12.58%
jan 1, 2001
12.36
-6.167
-33.29%
jan 1, 2002
12.797
+0.437
3.53%
jan 1, 2003
13.493
+0.696
5.44%
jan 1, 2004
13.475
-0.018
-0.13%
jan 1, 2005
13.673
+0.198
1.47%
jan 1, 2006
13.741
+0.068
0.49%
jan 1, 2007
13.576
-0.165
-1.2%
jan 1, 2008
14.377
+0.801
5.9%
jan 1, 2009
15.012
+0.635
4.42%
jan 1, 2010
17.658
+2.646
17.63%
jan 1, 2011
15.707
-1.951
-11.05%
jan 1, 2012
15.775
+0.068
0.43%
jan 1, 2013
16.185
+0.41
2.6%
jan 1, 2014
15.229
-0.956
-5.91%
jan 1, 2015
16.324
+1.095
7.19%
jan 1, 2016
17.033
+0.709
4.34%
Ranking of countries by current statistics by years


Comments: