29
/
en
AIzaSyAYiBZKx7MnpbEhh9jyipgxe19OcubqV5w
April 1, 2024
140362
Ghana
GHA
true
2
1
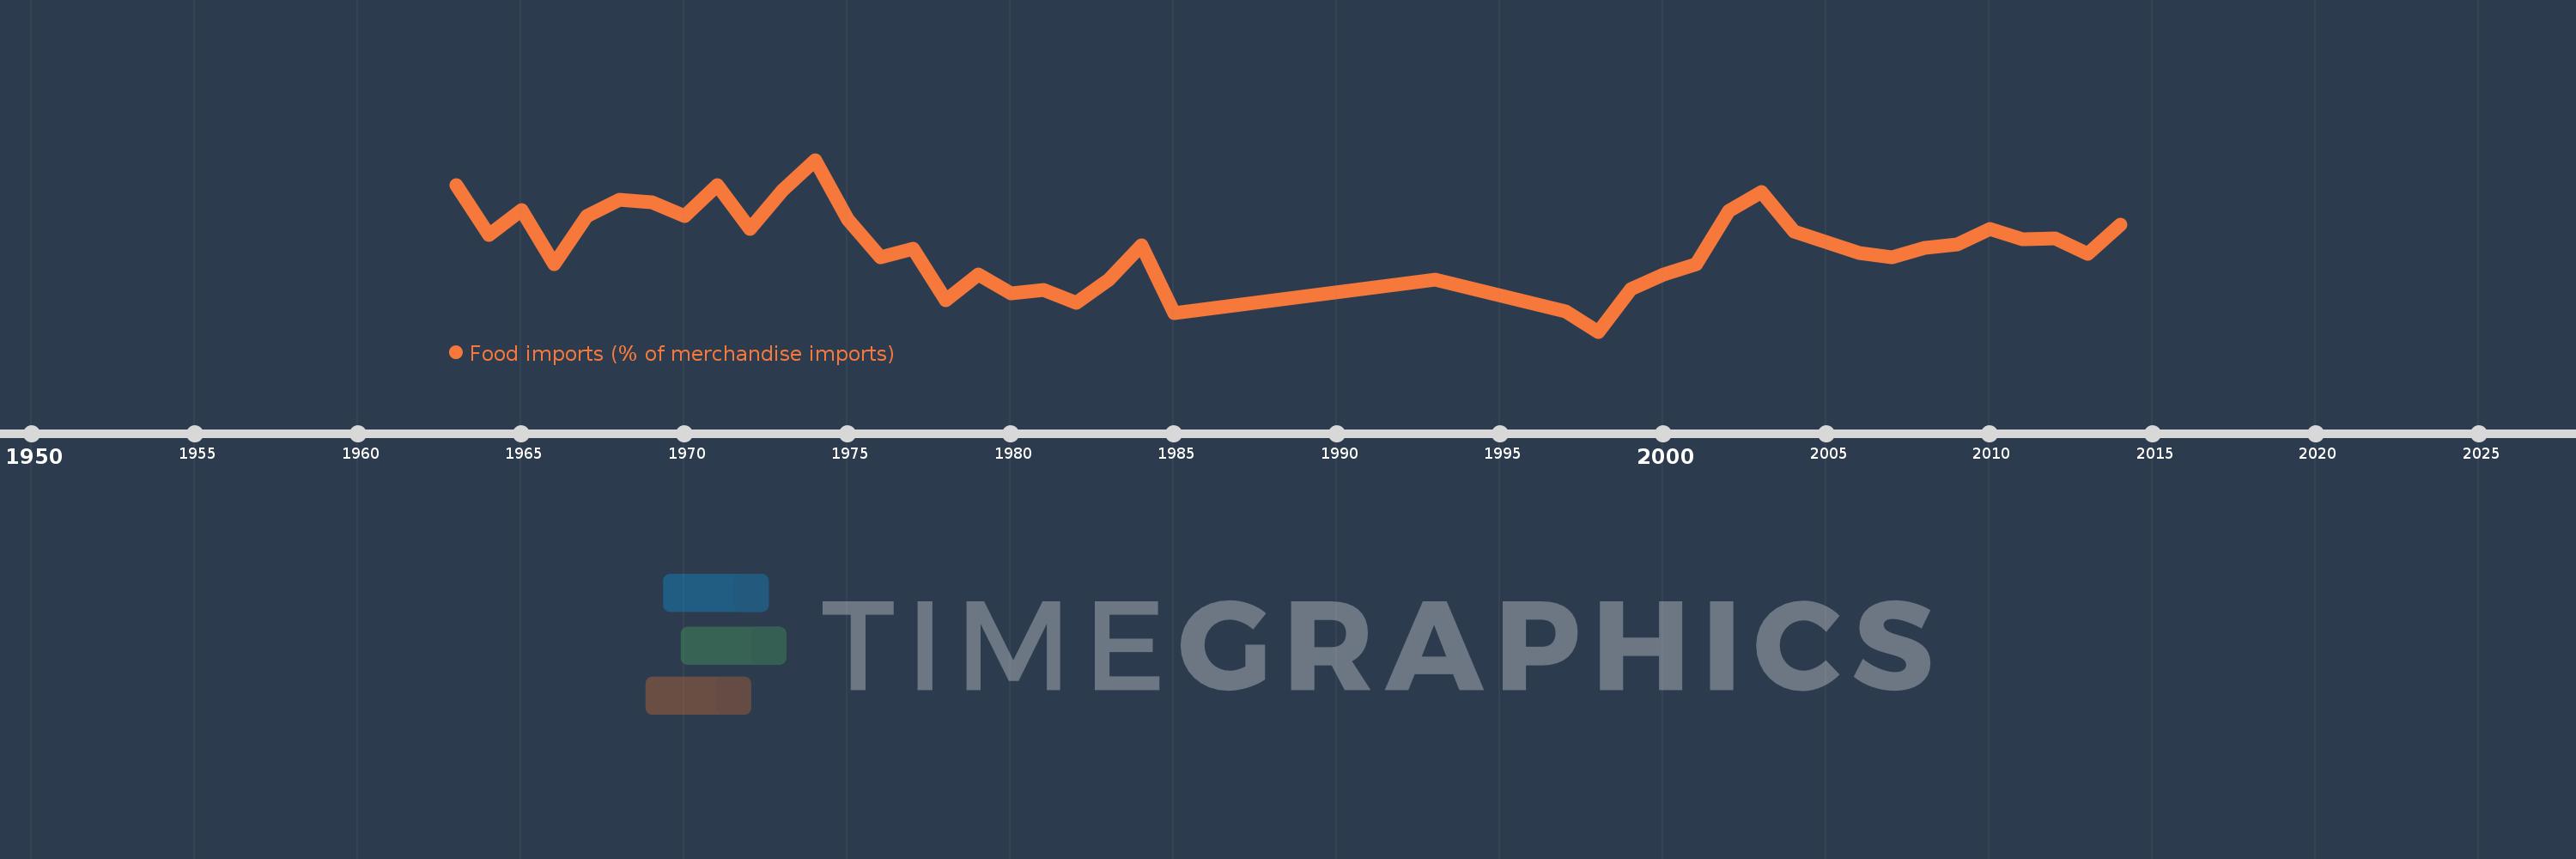
Food imports (% of merchandise imports)
2014,2013,2012,2011,2010,2009,2008,2007,2006,2004,2003,2002,2001,2000,1999,1998,1997,1993,1985,1984,1983,1982,1981,1980,1979,1978,1977,1976,1975,1974,1973,1972,1971,1970,1969,1968,1967,1966,1965,1964,1963
This statistics in other country:
AfghanistanAlbaniaAlgeriaAndorraAngolaAntigua and BarbudaArab WorldArgentinaArmeniaArubaAustraliaAustriaAzerbaijanBahamas, TheBahrainBangladeshBarbadosBelarusBelgiumBelizeBeninBermudaBhutanBoliviaBosnia and HerzegovinaBotswanaBrazilBrunei DarussalamBulgariaBurkina FasoBurundiCabo VerdeCambodiaCameroonCanadaCaribbean small statesCayman IslandsCentral African RepublicCentral Europe and the BalticsChadChileChinaColombiaComorosCongo, Dem. Rep.Congo, Rep.Costa RicaCote d'IvoireCroatiaCubaCyprusCzech RepublicDenmarkDjiboutiDominicaDominican RepublicEarly-demographic dividendEast Asia & PacificEast Asia & Pacific (excluding high income)East Asia & Pacific (IDA & IBRD countries)EcuadorEgypt, Arab Rep.El SalvadorEquatorial GuineaEritreaEstoniaEthiopiaEuro areaEurope & Central AsiaEurope & Central Asia (excluding high income)Europe & Central Asia (IDA & IBRD countries)European UnionFaroe IslandsFijiFinlandFragile and conflict affected situationsFranceFrench PolynesiaGabonGambia, TheGeorgiaGermanyGhanaGreeceGreenlandGrenadaGuatemalaGuineaGuinea-BissauGuyanaHaitiHeavily indebted poor countries (HIPC)High incomeHondurasHong Kong SAR, ChinaHungaryIBRD onlyIcelandIDA & IBRD totalIDA blendIDA onlyIDA totalIndiaIndonesiaIran, Islamic Rep.IraqIrelandIsraelItalyJamaicaJapanJordanKazakhstanKenyaKiribatiKorea, Rep.KuwaitKyrgyz RepublicLao PDRLate-demographic dividendLatin America & Caribbean Latin America & Caribbean (excluding high income)Latin America & the Caribbean (IDA & IBRD countries)LatviaLeast developed countries: UN classificationLebanonLesothoLiberiaLibyaLithuaniaLow & middle incomeLow incomeLower middle incomeLuxembourgMacao SAR, ChinaMacedonia, FYRMadagascarMalawiMalaysiaMaldivesMaliMaltaMauritaniaMauritiusMexicoMiddle East & North AfricaMiddle East & North Africa (excluding high income)Middle East & North Africa (IDA & IBRD countries)Middle incomeMoldovaMongoliaMoroccoMozambiqueMyanmarNamibiaNepalNetherlandsNew CaledoniaNew ZealandNicaraguaNigerNigeriaNorth AmericaNorwayOECD membersOmanOther small statesPacific island small statesPakistanPalauPanamaPapua New GuineaParaguayPeruPhilippinesPolandPortugalPost-demographic dividendPre-demographic dividendQatarRomaniaRussian FederationRwandaSamoaSao Tome and PrincipeSaudi ArabiaSenegalSerbiaSeychellesSierra LeoneSingaporeSlovak RepublicSloveniaSmall statesSolomon IslandsSomaliaSouth AfricaSouth AsiaSouth Asia (IDA & IBRD)SpainSri LankaSt. Kitts and NevisSt. LuciaSt. Vincent and the GrenadinesSub-Saharan Africa Sub-Saharan Africa (excluding high income)Sub-Saharan Africa (IDA & IBRD countries)SudanSurinameSwazilandSwedenSwitzerlandSyrian Arab RepublicTajikistanTanzaniaThailandTimor-LesteTogoTongaTrinidad and TobagoTunisiaTurkeyTurkmenistanTurks and Caicos IslandsTuvaluUgandaUkraineUnited Arab EmiratesUnited KingdomUnited StatesUpper middle incomeUruguayVanuatuVenezuela, RBVietnamVirgin Islands (U.S.)WorldYemen, Rep.ZambiaZimbabwe Timeline:
This timeline shows a graph from 1963 to 2014 of Ghana. No data until 1962. Number of actual observations by date: 41.
Source name:
World Development Indicators
Source organization:
World Bank staff estimates from the Comtrade database maintained by the United Nations Statistics Division.
Categories, topics:
Private Sector, Trade
Last updated:
apr 23, 2017
Indicators value changes by year
Maximum:
23.442
jan 1, 1974
At the date of observation
Value
Absolute change
Change from previous value
jan 1, 1963
20.827
+20.827
0.0%
jan 1, 1964
15.732
-5.096
-24.47%
jan 1, 1965
18.297
+2.565
16.31%
jan 1, 1966
12.785
-5.512
-30.12%
jan 1, 1967
17.674
+4.889
38.24%
jan 1, 1968
19.342
+1.668
9.44%
jan 1, 1969
19.121
-0.221
-1.14%
jan 1, 1970
17.679
-1.442
-7.54%
jan 1, 1971
20.854
+3.175
17.96%
jan 1, 1972
16.376
-4.478
-21.47%
jan 1, 1973
20.323
+3.947
24.1%
jan 1, 1974
23.442
+3.119
15.35%
jan 1, 1975
17.292
-6.15
-26.23%
jan 1, 1976
13.424
-3.868
-22.37%
jan 1, 1977
14.371
+0.947
7.05%
jan 1, 1978
9.083
-5.289
-36.8%
jan 1, 1979
11.659
+2.576
28.37%
jan 1, 1980
9.763
-1.896
-16.26%
jan 1, 1981
10.093
+0.33
3.38%
jan 1, 1982
8.816
-1.277
-12.65%
jan 1, 1983
11.163
+2.347
26.62%
jan 1, 1984
14.664
+3.501
31.36%
jan 1, 1985
7.717
-6.946
-47.37%
jan 1, 1993
11.189
+3.472
44.99%
jan 1, 1997
7.906
-3.283
-29.34%
jan 1, 1998
5.845
-2.06
-26.06%
jan 1, 1999
10.23
+4.385
75.01%
jan 1, 2000
11.727
+1.497
14.64%
jan 1, 2001
12.76
+1.032
8.8%
jan 1, 2002
18.2
+5.44
42.64%
jan 1, 2003
20.102
+1.902
10.45%
jan 1, 2004
16.11
-3.992
-19.86%
jan 1, 2006
13.896
-2.214
-13.74%
jan 1, 2007
13.448
-0.449
-3.23%
jan 1, 2008
14.398
+0.951
7.07%
jan 1, 2009
14.756
+0.358
2.49%
jan 1, 2010
16.335
+1.578
10.7%
jan 1, 2011
15.327
-1.008
-6.17%
jan 1, 2012
15.388
+0.061
0.4%
jan 1, 2013
13.833
-1.555
-10.11%
jan 1, 2014
16.79
+2.957
21.38%
Ranking of countries by current statistics by years


Comments: