29
/
en
AIzaSyAYiBZKx7MnpbEhh9jyipgxe19OcubqV5w
April 1, 2024
92563
Brunei Darussalam
BRN
true
2
1
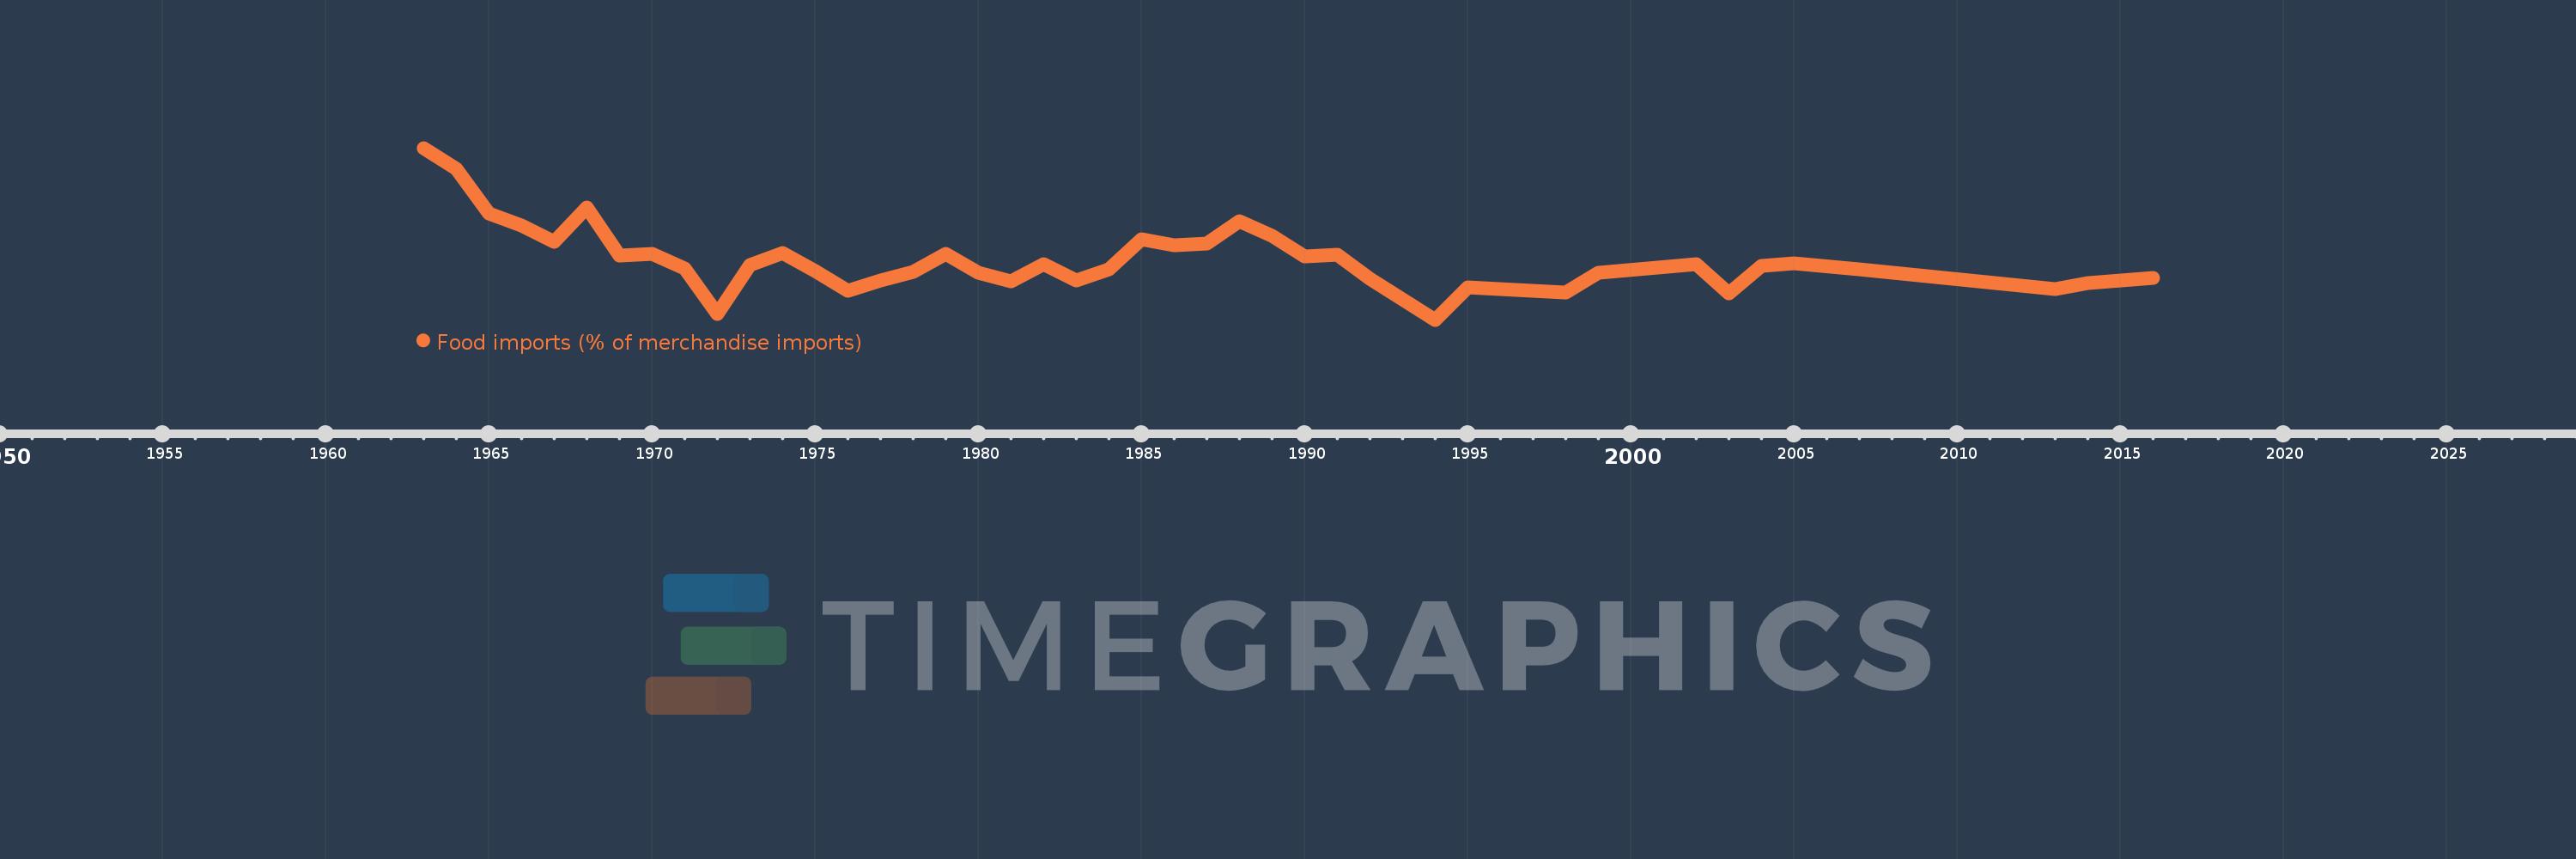
Food imports (% of merchandise imports)
2016,2015,2014,2013,2007,2005,2004,2003,2002,1999,1998,1995,1994,1993,1992,1991,1990,1989,1988,1987,1986,1985,1984,1983,1982,1981,1980,1979,1978,1977,1976,1975,1974,1973,1972,1971,1970,1969,1968,1967,1966,1965,1964,1963
This statistics in other country:
AfghanistanAlbaniaAlgeriaAndorraAngolaAntigua and BarbudaArab WorldArgentinaArmeniaArubaAustraliaAustriaAzerbaijanBahamas, TheBahrainBangladeshBarbadosBelarusBelgiumBelizeBeninBermudaBhutanBoliviaBosnia and HerzegovinaBotswanaBrazilBrunei DarussalamBulgariaBurkina FasoBurundiCabo VerdeCambodiaCameroonCanadaCaribbean small statesCayman IslandsCentral African RepublicCentral Europe and the BalticsChadChileChinaColombiaComorosCongo, Dem. Rep.Congo, Rep.Costa RicaCote d'IvoireCroatiaCubaCyprusCzech RepublicDenmarkDjiboutiDominicaDominican RepublicEarly-demographic dividendEast Asia & PacificEast Asia & Pacific (excluding high income)East Asia & Pacific (IDA & IBRD countries)EcuadorEgypt, Arab Rep.El SalvadorEquatorial GuineaEritreaEstoniaEthiopiaEuro areaEurope & Central AsiaEurope & Central Asia (excluding high income)Europe & Central Asia (IDA & IBRD countries)European UnionFaroe IslandsFijiFinlandFragile and conflict affected situationsFranceFrench PolynesiaGabonGambia, TheGeorgiaGermanyGhanaGreeceGreenlandGrenadaGuatemalaGuineaGuinea-BissauGuyanaHaitiHeavily indebted poor countries (HIPC)High incomeHondurasHong Kong SAR, ChinaHungaryIBRD onlyIcelandIDA & IBRD totalIDA blendIDA onlyIDA totalIndiaIndonesiaIran, Islamic Rep.IraqIrelandIsraelItalyJamaicaJapanJordanKazakhstanKenyaKiribatiKorea, Rep.KuwaitKyrgyz RepublicLao PDRLate-demographic dividendLatin America & Caribbean Latin America & Caribbean (excluding high income)Latin America & the Caribbean (IDA & IBRD countries)LatviaLeast developed countries: UN classificationLebanonLesothoLiberiaLibyaLithuaniaLow & middle incomeLow incomeLower middle incomeLuxembourgMacao SAR, ChinaMacedonia, FYRMadagascarMalawiMalaysiaMaldivesMaliMaltaMauritaniaMauritiusMexicoMiddle East & North AfricaMiddle East & North Africa (excluding high income)Middle East & North Africa (IDA & IBRD countries)Middle incomeMoldovaMongoliaMoroccoMozambiqueMyanmarNamibiaNepalNetherlandsNew CaledoniaNew ZealandNicaraguaNigerNigeriaNorth AmericaNorwayOECD membersOmanOther small statesPacific island small statesPakistanPalauPanamaPapua New GuineaParaguayPeruPhilippinesPolandPortugalPost-demographic dividendPre-demographic dividendQatarRomaniaRussian FederationRwandaSamoaSao Tome and PrincipeSaudi ArabiaSenegalSerbiaSeychellesSierra LeoneSingaporeSlovak RepublicSloveniaSmall statesSolomon IslandsSomaliaSouth AfricaSouth AsiaSouth Asia (IDA & IBRD)SpainSri LankaSt. Kitts and NevisSt. LuciaSt. Vincent and the GrenadinesSub-Saharan Africa Sub-Saharan Africa (excluding high income)Sub-Saharan Africa (IDA & IBRD countries)SudanSurinameSwazilandSwedenSwitzerlandSyrian Arab RepublicTajikistanTanzaniaThailandTimor-LesteTogoTongaTrinidad and TobagoTunisiaTurkeyTurkmenistanTurks and Caicos IslandsTuvaluUgandaUkraineUnited Arab EmiratesUnited KingdomUnited StatesUpper middle incomeUruguayVanuatuVenezuela, RBVietnamVirgin Islands (U.S.)WorldYemen, Rep.ZambiaZimbabwe Timeline:
This timeline shows a graph from 1963 to 2016 of Brunei Darussalam. No data until 1962. Number of actual observations by date: 44.
Source name:
World Development Indicators
Source organization:
World Bank staff estimates from the Comtrade database maintained by the United Nations Statistics Division.
Categories, topics:
Private Sector, Trade
Last updated:
apr 23, 2017
Indicators value changes by year
Maximum:
35.148
jan 1, 1963
At the date of observation
Value
Absolute change
Change from previous value
jan 1, 1963
35.148
+35.148
0.0%
jan 1, 1964
31.982
-3.166
-9.01%
jan 1, 1965
25.369
-6.614
-20.68%
jan 1, 1966
23.526
-1.842
-7.26%
jan 1, 1967
21.176
-2.35
-9.99%
jan 1, 1968
26.316
+5.14
24.27%
jan 1, 1969
19.131
-7.185
-27.3%
jan 1, 1970
19.4
+0.269
1.41%
jan 1, 1971
17.159
-2.241
-11.55%
jan 1, 1972
10.298
-6.861
-39.98%
jan 1, 1973
17.676
+7.378
71.64%
jan 1, 1974
19.419
+1.743
9.86%
jan 1, 1975
16.754
-2.666
-13.73%
jan 1, 1976
13.861
-2.893
-17.27%
jan 1, 1977
15.328
+1.467
10.58%
jan 1, 1978
16.67
+1.343
8.76%
jan 1, 1979
19.29
+2.62
15.72%
jan 1, 1980
16.53
-2.761
-14.31%
jan 1, 1981
15.18
-1.349
-8.16%
jan 1, 1982
17.766
+2.586
17.03%
jan 1, 1983
15.357
-2.409
-13.56%
jan 1, 1984
17.031
+1.674
10.9%
jan 1, 1985
21.519
+4.488
26.35%
jan 1, 1986
20.622
-0.897
-4.17%
jan 1, 1987
20.829
+0.207
1.0%
jan 1, 1988
24.238
+3.409
16.37%
jan 1, 1989
22.05
-2.187
-9.02%
jan 1, 1990
18.928
-3.123
-14.16%
jan 1, 1991
19.201
+0.274
1.45%
jan 1, 1992
15.667
-3.535
-18.41%
jan 1, 1993
12.581
-3.086
-19.7%
jan 1, 1994
9.501
-3.08
-24.48%
jan 1, 1995
14.37
+4.869
51.25%
jan 1, 1998
13.552
-0.818
-5.69%
jan 1, 1999
16.522
+2.97
21.91%
jan 1, 2002
17.854
+1.332
8.06%
jan 1, 2003
13.41
-4.444
-24.89%
jan 1, 2004
17.57
+4.16
31.02%
jan 1, 2005
17.921
+0.35
1.99%
jan 1, 2007
17.023
-0.897
-5.01%
jan 1, 2013
14.037
-2.986
-17.54%
jan 1, 2014
15.028
+0.991
7.06%
jan 1, 2015
15.407
+0.378
2.52%
jan 1, 2016
15.699
+0.293
1.9%
Ranking of countries by current statistics by years


Comments: