29
/
en
AIzaSyAYiBZKx7MnpbEhh9jyipgxe19OcubqV5w
April 1, 2024
195527
Mexico
MEX
true
2
1
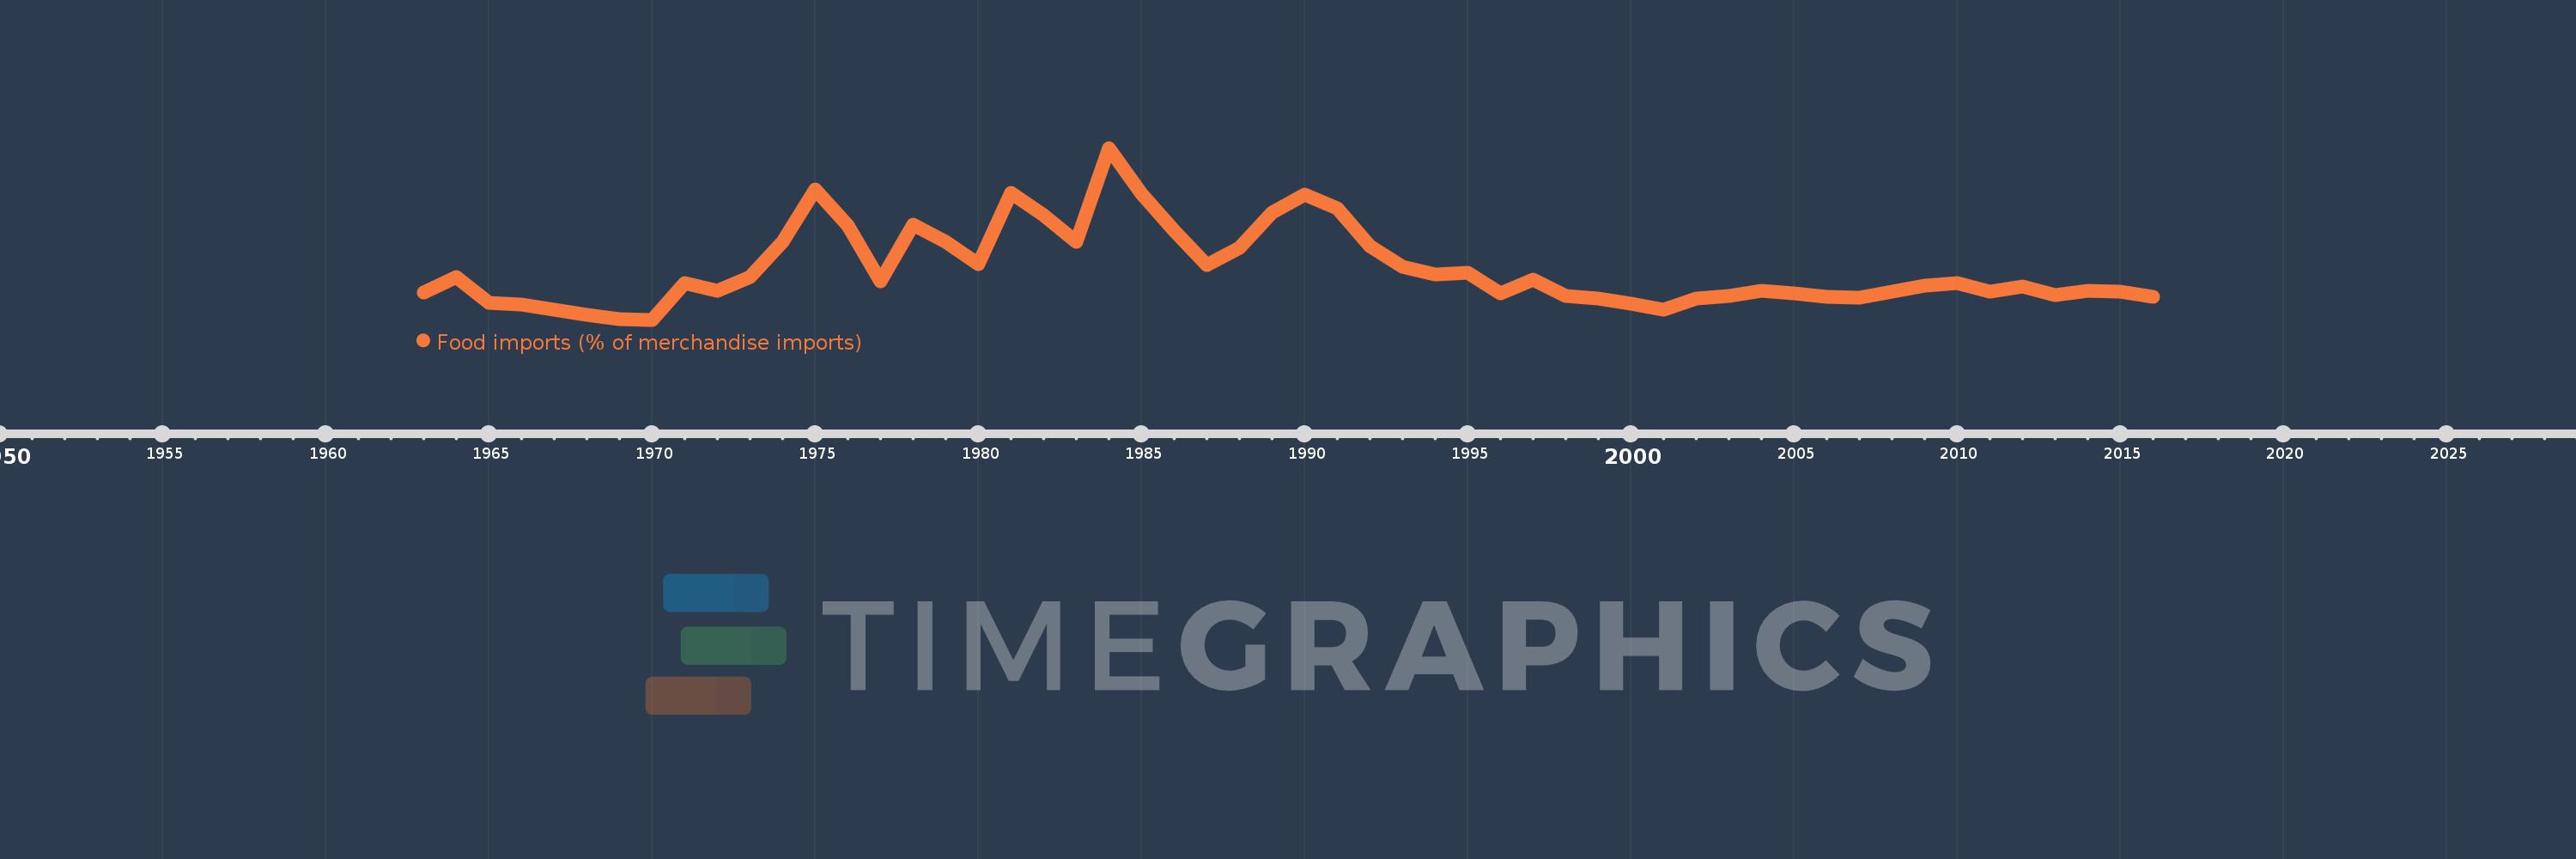
Food imports (% of merchandise imports)
2016,2015,2014,2013,2012,2011,2010,2009,2008,2007,2006,2005,2004,2003,2002,2001,2000,1999,1998,1997,1996,1995,1994,1993,1992,1991,1990,1989,1988,1987,1986,1985,1984,1983,1982,1981,1980,1979,1978,1977,1976,1975,1974,1973,1972,1971,1970,1969,1968,1967,1966,1965,1964,1963
This statistics in other country:
AfghanistanAlbaniaAlgeriaAndorraAngolaAntigua and BarbudaArab WorldArgentinaArmeniaArubaAustraliaAustriaAzerbaijanBahamas, TheBahrainBangladeshBarbadosBelarusBelgiumBelizeBeninBermudaBhutanBoliviaBosnia and HerzegovinaBotswanaBrazilBrunei DarussalamBulgariaBurkina FasoBurundiCabo VerdeCambodiaCameroonCanadaCaribbean small statesCayman IslandsCentral African RepublicCentral Europe and the BalticsChadChileChinaColombiaComorosCongo, Dem. Rep.Congo, Rep.Costa RicaCote d'IvoireCroatiaCubaCyprusCzech RepublicDenmarkDjiboutiDominicaDominican RepublicEarly-demographic dividendEast Asia & PacificEast Asia & Pacific (excluding high income)East Asia & Pacific (IDA & IBRD countries)EcuadorEgypt, Arab Rep.El SalvadorEquatorial GuineaEritreaEstoniaEthiopiaEuro areaEurope & Central AsiaEurope & Central Asia (excluding high income)Europe & Central Asia (IDA & IBRD countries)European UnionFaroe IslandsFijiFinlandFragile and conflict affected situationsFranceFrench PolynesiaGabonGambia, TheGeorgiaGermanyGhanaGreeceGreenlandGrenadaGuatemalaGuineaGuinea-BissauGuyanaHaitiHeavily indebted poor countries (HIPC)High incomeHondurasHong Kong SAR, ChinaHungaryIBRD onlyIcelandIDA & IBRD totalIDA blendIDA onlyIDA totalIndiaIndonesiaIran, Islamic Rep.IraqIrelandIsraelItalyJamaicaJapanJordanKazakhstanKenyaKiribatiKorea, Rep.KuwaitKyrgyz RepublicLao PDRLate-demographic dividendLatin America & Caribbean Latin America & Caribbean (excluding high income)Latin America & the Caribbean (IDA & IBRD countries)LatviaLeast developed countries: UN classificationLebanonLesothoLiberiaLibyaLithuaniaLow & middle incomeLow incomeLower middle incomeLuxembourgMacao SAR, ChinaMacedonia, FYRMadagascarMalawiMalaysiaMaldivesMaliMaltaMauritaniaMauritiusMexicoMiddle East & North AfricaMiddle East & North Africa (excluding high income)Middle East & North Africa (IDA & IBRD countries)Middle incomeMoldovaMongoliaMoroccoMozambiqueMyanmarNamibiaNepalNetherlandsNew CaledoniaNew ZealandNicaraguaNigerNigeriaNorth AmericaNorwayOECD membersOmanOther small statesPacific island small statesPakistanPalauPanamaPapua New GuineaParaguayPeruPhilippinesPolandPortugalPost-demographic dividendPre-demographic dividendQatarRomaniaRussian FederationRwandaSamoaSao Tome and PrincipeSaudi ArabiaSenegalSerbiaSeychellesSierra LeoneSingaporeSlovak RepublicSloveniaSmall statesSolomon IslandsSomaliaSouth AfricaSouth AsiaSouth Asia (IDA & IBRD)SpainSri LankaSt. Kitts and NevisSt. LuciaSt. Vincent and the GrenadinesSub-Saharan Africa Sub-Saharan Africa (excluding high income)Sub-Saharan Africa (IDA & IBRD countries)SudanSurinameSwazilandSwedenSwitzerlandSyrian Arab RepublicTajikistanTanzaniaThailandTimor-LesteTogoTongaTrinidad and TobagoTunisiaTurkeyTurkmenistanTurks and Caicos IslandsTuvaluUgandaUkraineUnited Arab EmiratesUnited KingdomUnited StatesUpper middle incomeUruguayVanuatuVenezuela, RBVietnamVirgin Islands (U.S.)WorldYemen, Rep.ZambiaZimbabwe Timeline:
This timeline shows a graph from 1963 to 2016 of Mexico. No data until 1962. Number of actual observations by date: 54.
Source name:
World Development Indicators
Source organization:
World Bank staff estimates from the Comtrade database maintained by the United Nations Statistics Division.
Categories, topics:
Private Sector, Trade
Last updated:
apr 23, 2017
Indicators value changes by year
Maximum:
20.557
jan 1, 1984
At the date of observation
Value
Absolute change
Change from previous value
jan 1, 1963
6.429
+6.429
0.0%
jan 1, 1964
7.948
+1.52
23.64%
jan 1, 1965
5.357
-2.591
-32.6%
jan 1, 1966
5.217
-0.14
-2.62%
jan 1, 1967
4.696
-0.521
-9.99%
jan 1, 1968
4.174
-0.521
-11.1%
jan 1, 1969
3.766
-0.408
-9.78%
jan 1, 1970
3.733
-0.034
-0.9%
jan 1, 1971
7.357
+3.625
97.11%
jan 1, 1972
6.543
-0.814
-11.06%
jan 1, 1973
7.874
+1.331
20.34%
jan 1, 1974
11.338
+3.464
43.99%
jan 1, 1975
16.473
+5.134
45.29%
jan 1, 1976
12.967
-3.505
-21.28%
jan 1, 1977
7.473
-5.494
-42.37%
jan 1, 1978
13.08
+5.607
75.03%
jan 1, 1979
11.356
-1.725
-13.19%
jan 1, 1980
9.196
-2.159
-19.01%
jan 1, 1981
16.126
+6.93
75.35%
jan 1, 1982
13.958
-2.168
-13.44%
jan 1, 1983
11.375
-2.583
-18.51%
jan 1, 1984
20.557
+9.182
80.72%
jan 1, 1985
16.033
-4.524
-22.01%
jan 1, 1986
12.444
-3.589
-22.39%
jan 1, 1987
9.056
-3.388
-27.22%
jan 1, 1988
10.784
+1.728
19.08%
jan 1, 1989
14.25
+3.466
32.14%
jan 1, 1990
15.949
+1.7
11.93%
jan 1, 1991
14.635
-1.314
-8.24%
jan 1, 1992
10.926
-3.709
-25.35%
jan 1, 1993
8.964
-1.961
-17.95%
jan 1, 1994
8.138
-0.826
-9.22%
jan 1, 1995
8.35
+0.212
2.6%
jan 1, 1996
6.323
-2.027
-24.27%
jan 1, 1997
7.627
+1.304
20.62%
jan 1, 1998
6.071
-1.556
-20.4%
jan 1, 1999
5.834
-0.237
-3.9%
jan 1, 2000
5.29
-0.543
-9.31%
jan 1, 2001
4.738
-0.553
-10.45%
jan 1, 2002
5.818
+1.081
22.81%
jan 1, 2003
6.055
+0.237
4.07%
jan 1, 2004
6.553
+0.498
8.22%
jan 1, 2005
6.321
-0.231
-3.53%
jan 1, 2006
6.004
-0.317
-5.02%
jan 1, 2007
5.855
-0.149
-2.48%
jan 1, 2008
6.485
+0.629
10.75%
jan 1, 2009
7.107
+0.622
9.6%
jan 1, 2010
7.349
+0.242
3.41%
jan 1, 2011
6.468
-0.881
-11.99%
jan 1, 2012
6.988
+0.52
8.04%
jan 1, 2013
6.16
-0.828
-11.84%
jan 1, 2014
6.579
+0.419
6.8%
jan 1, 2015
6.443
-0.136
-2.07%
jan 1, 2016
5.954
-0.489
-7.59%
Ranking of countries by current statistics by years


Comments: