29
/
en
AIzaSyAYiBZKx7MnpbEhh9jyipgxe19OcubqV5w
April 1, 2024
150350
Honduras
HND
true
2
1
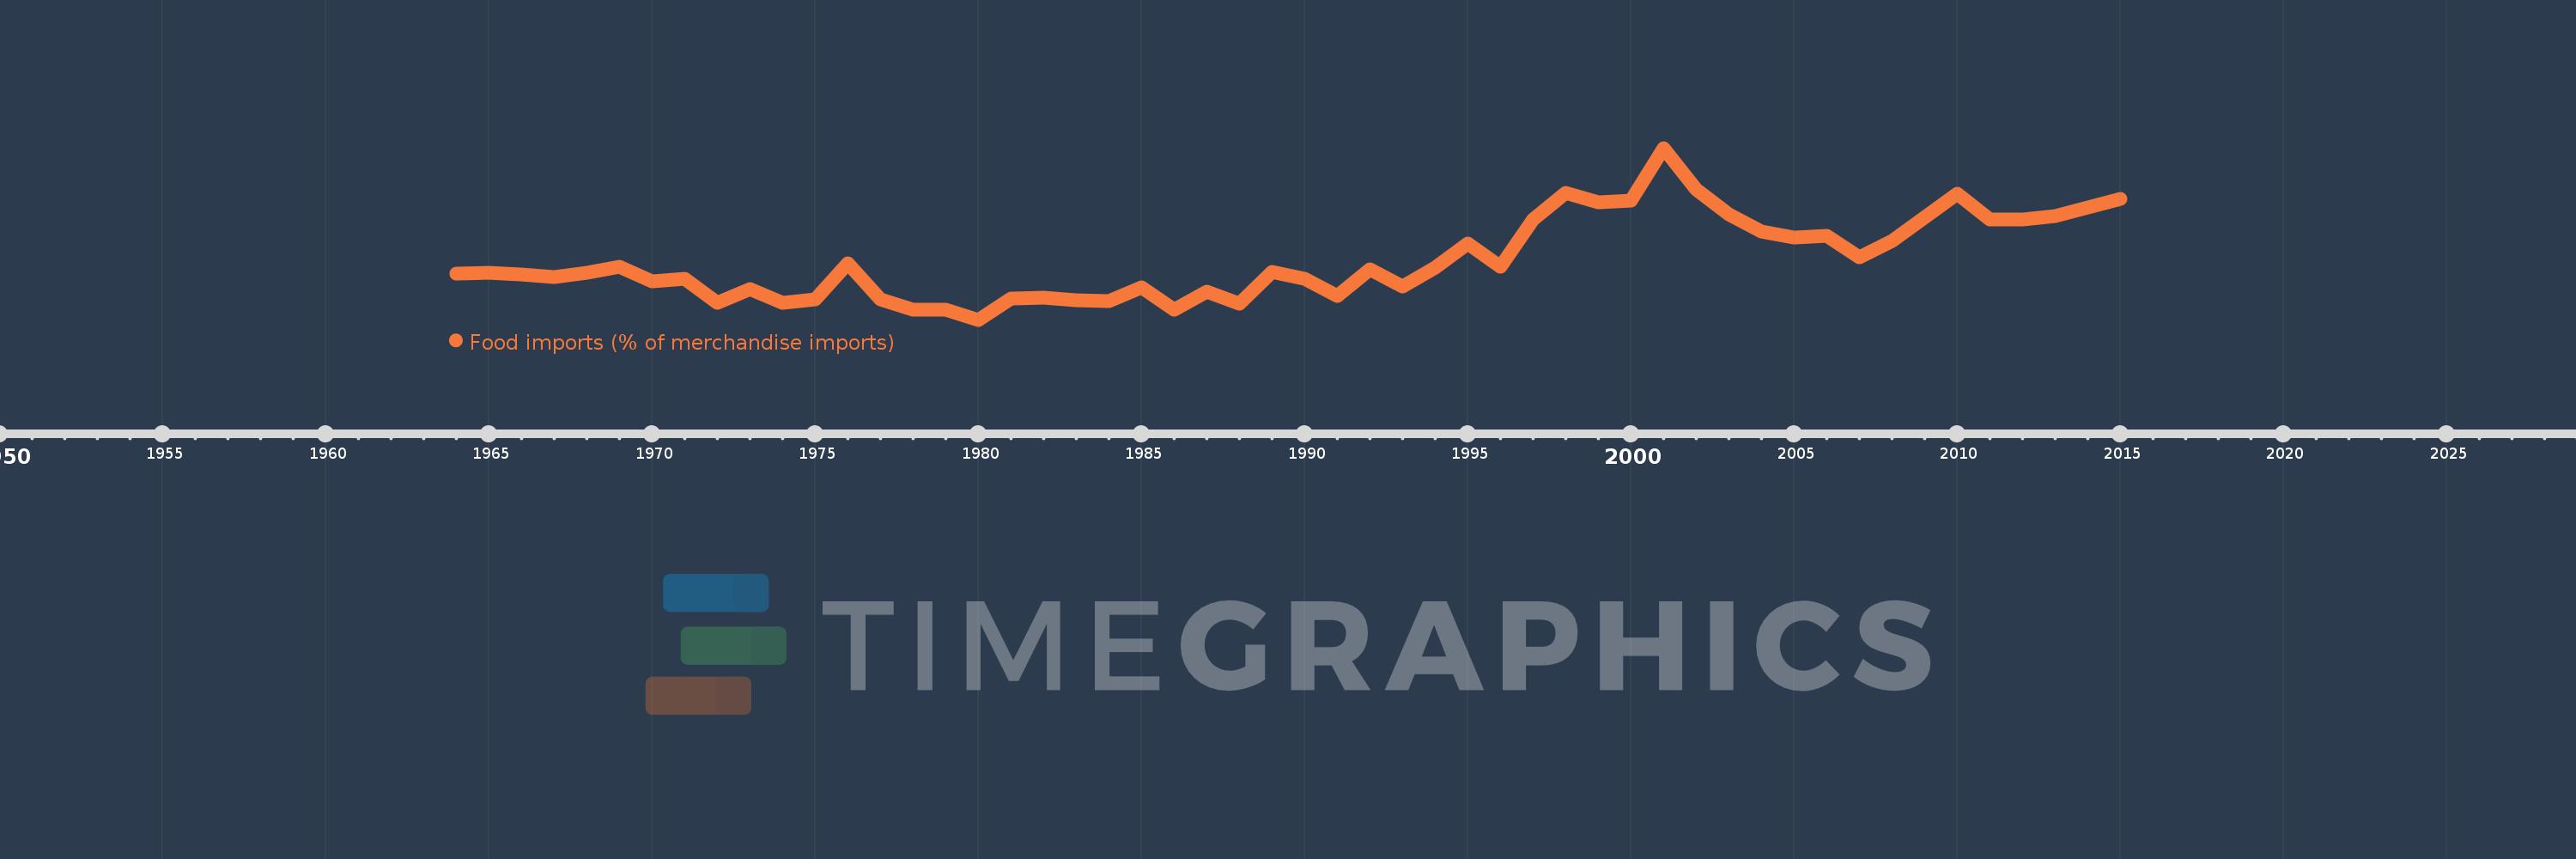
Food imports (% of merchandise imports)
2015,2013,2012,2011,2010,2008,2007,2006,2005,2004,2003,2002,2001,2000,1999,1998,1997,1996,1995,1994,1993,1992,1991,1990,1989,1988,1987,1986,1985,1984,1983,1982,1981,1980,1979,1978,1977,1976,1975,1974,1973,1972,1971,1970,1969,1968,1967,1966,1965,1964
This statistics in other country:
AfghanistanAlbaniaAlgeriaAndorraAngolaAntigua and BarbudaArab WorldArgentinaArmeniaArubaAustraliaAustriaAzerbaijanBahamas, TheBahrainBangladeshBarbadosBelarusBelgiumBelizeBeninBermudaBhutanBoliviaBosnia and HerzegovinaBotswanaBrazilBrunei DarussalamBulgariaBurkina FasoBurundiCabo VerdeCambodiaCameroonCanadaCaribbean small statesCayman IslandsCentral African RepublicCentral Europe and the BalticsChadChileChinaColombiaComorosCongo, Dem. Rep.Congo, Rep.Costa RicaCote d'IvoireCroatiaCubaCyprusCzech RepublicDenmarkDjiboutiDominicaDominican RepublicEarly-demographic dividendEast Asia & PacificEast Asia & Pacific (excluding high income)East Asia & Pacific (IDA & IBRD countries)EcuadorEgypt, Arab Rep.El SalvadorEquatorial GuineaEritreaEstoniaEthiopiaEuro areaEurope & Central AsiaEurope & Central Asia (excluding high income)Europe & Central Asia (IDA & IBRD countries)European UnionFaroe IslandsFijiFinlandFragile and conflict affected situationsFranceFrench PolynesiaGabonGambia, TheGeorgiaGermanyGhanaGreeceGreenlandGrenadaGuatemalaGuineaGuinea-BissauGuyanaHaitiHeavily indebted poor countries (HIPC)High incomeHondurasHong Kong SAR, ChinaHungaryIBRD onlyIcelandIDA & IBRD totalIDA blendIDA onlyIDA totalIndiaIndonesiaIran, Islamic Rep.IraqIrelandIsraelItalyJamaicaJapanJordanKazakhstanKenyaKiribatiKorea, Rep.KuwaitKyrgyz RepublicLao PDRLate-demographic dividendLatin America & Caribbean Latin America & Caribbean (excluding high income)Latin America & the Caribbean (IDA & IBRD countries)LatviaLeast developed countries: UN classificationLebanonLesothoLiberiaLibyaLithuaniaLow & middle incomeLow incomeLower middle incomeLuxembourgMacao SAR, ChinaMacedonia, FYRMadagascarMalawiMalaysiaMaldivesMaliMaltaMauritaniaMauritiusMexicoMiddle East & North AfricaMiddle East & North Africa (excluding high income)Middle East & North Africa (IDA & IBRD countries)Middle incomeMoldovaMongoliaMoroccoMozambiqueMyanmarNamibiaNepalNetherlandsNew CaledoniaNew ZealandNicaraguaNigerNigeriaNorth AmericaNorwayOECD membersOmanOther small statesPacific island small statesPakistanPalauPanamaPapua New GuineaParaguayPeruPhilippinesPolandPortugalPost-demographic dividendPre-demographic dividendQatarRomaniaRussian FederationRwandaSamoaSao Tome and PrincipeSaudi ArabiaSenegalSerbiaSeychellesSierra LeoneSingaporeSlovak RepublicSloveniaSmall statesSolomon IslandsSomaliaSouth AfricaSouth AsiaSouth Asia (IDA & IBRD)SpainSri LankaSt. Kitts and NevisSt. LuciaSt. Vincent and the GrenadinesSub-Saharan Africa Sub-Saharan Africa (excluding high income)Sub-Saharan Africa (IDA & IBRD countries)SudanSurinameSwazilandSwedenSwitzerlandSyrian Arab RepublicTajikistanTanzaniaThailandTimor-LesteTogoTongaTrinidad and TobagoTunisiaTurkeyTurkmenistanTurks and Caicos IslandsTuvaluUgandaUkraineUnited Arab EmiratesUnited KingdomUnited StatesUpper middle incomeUruguayVanuatuVenezuela, RBVietnamVirgin Islands (U.S.)WorldYemen, Rep.ZambiaZimbabwe Timeline:
This timeline shows a graph from 1964 to 2015 of Honduras. No data until 1963. Number of actual observations by date: 50.
Source name:
World Development Indicators
Source organization:
World Bank staff estimates from the Comtrade database maintained by the United Nations Statistics Division.
Categories, topics:
Private Sector, Trade
Last updated:
apr 23, 2017
Indicators value changes by year
Maximum:
22.159
jan 1, 2001
At the date of observation
Value
Absolute change
Change from previous value
jan 1, 1964
12.032
+12.032
0.0%
jan 1, 1965
12.1
+0.068
0.57%
jan 1, 1966
11.958
-0.142
-1.18%
jan 1, 1967
11.764
-0.193
-1.62%
jan 1, 1968
12.116
+0.352
2.99%
jan 1, 1969
12.602
+0.486
4.01%
jan 1, 1970
11.468
-1.134
-9.0%
jan 1, 1971
11.649
+0.181
1.58%
jan 1, 1972
9.681
-1.968
-16.9%
jan 1, 1973
10.833
+1.152
11.9%
jan 1, 1974
9.729
-1.104
-10.19%
jan 1, 1975
9.975
+0.245
2.52%
jan 1, 1976
12.885
+2.91
29.18%
jan 1, 1977
9.974
-2.911
-22.59%
jan 1, 1978
9.153
-0.821
-8.23%
jan 1, 1979
9.17
+0.017
0.19%
jan 1, 1980
8.347
-0.824
-8.98%
jan 1, 1981
10.082
+1.736
20.8%
jan 1, 1982
10.138
+0.055
0.55%
jan 1, 1983
9.935
-0.202
-2.0%
jan 1, 1984
9.839
-0.096
-0.97%
jan 1, 1985
10.941
+1.102
11.2%
jan 1, 1986
9.14
-1.801
-16.46%
jan 1, 1987
10.581
+1.441
15.77%
jan 1, 1988
9.645
-0.935
-8.84%
jan 1, 1989
12.173
+2.528
26.21%
jan 1, 1990
11.624
-0.549
-4.51%
jan 1, 1991
10.241
-1.383
-11.9%
jan 1, 1992
12.372
+2.13
20.8%
jan 1, 1993
10.999
-1.372
-11.09%
jan 1, 1994
12.535
+1.535
13.96%
jan 1, 1995
14.485
+1.95
15.56%
jan 1, 1996
12.627
-1.858
-12.83%
jan 1, 1997
16.419
+3.793
30.04%
jan 1, 1998
18.549
+2.13
12.97%
jan 1, 1999
17.78
-0.769
-4.15%
jan 1, 2000
17.92
+0.14
0.79%
jan 1, 2001
22.159
+4.239
23.66%
jan 1, 2002
18.792
-3.366
-15.19%
jan 1, 2003
16.805
-1.987
-10.57%
jan 1, 2004
15.444
-1.361
-8.1%
jan 1, 2005
14.982
-0.462
-2.99%
jan 1, 2006
15.067
+0.085
0.57%
jan 1, 2007
13.395
-1.672
-11.1%
jan 1, 2008
14.668
+1.273
9.5%
jan 1, 2010
18.462
+3.794
25.87%
jan 1, 2011
16.412
-2.051
-11.11%
jan 1, 2012
16.4
-0.012
-0.07%
jan 1, 2013
16.705
+0.305
1.86%
jan 1, 2015
18.071
+1.366
8.18%
Ranking of countries by current statistics by years


Comments: