29
/
en
AIzaSyAYiBZKx7MnpbEhh9jyipgxe19OcubqV5w
April 1, 2024
113562
Cote d'Ivoire
CIV
true
2
1
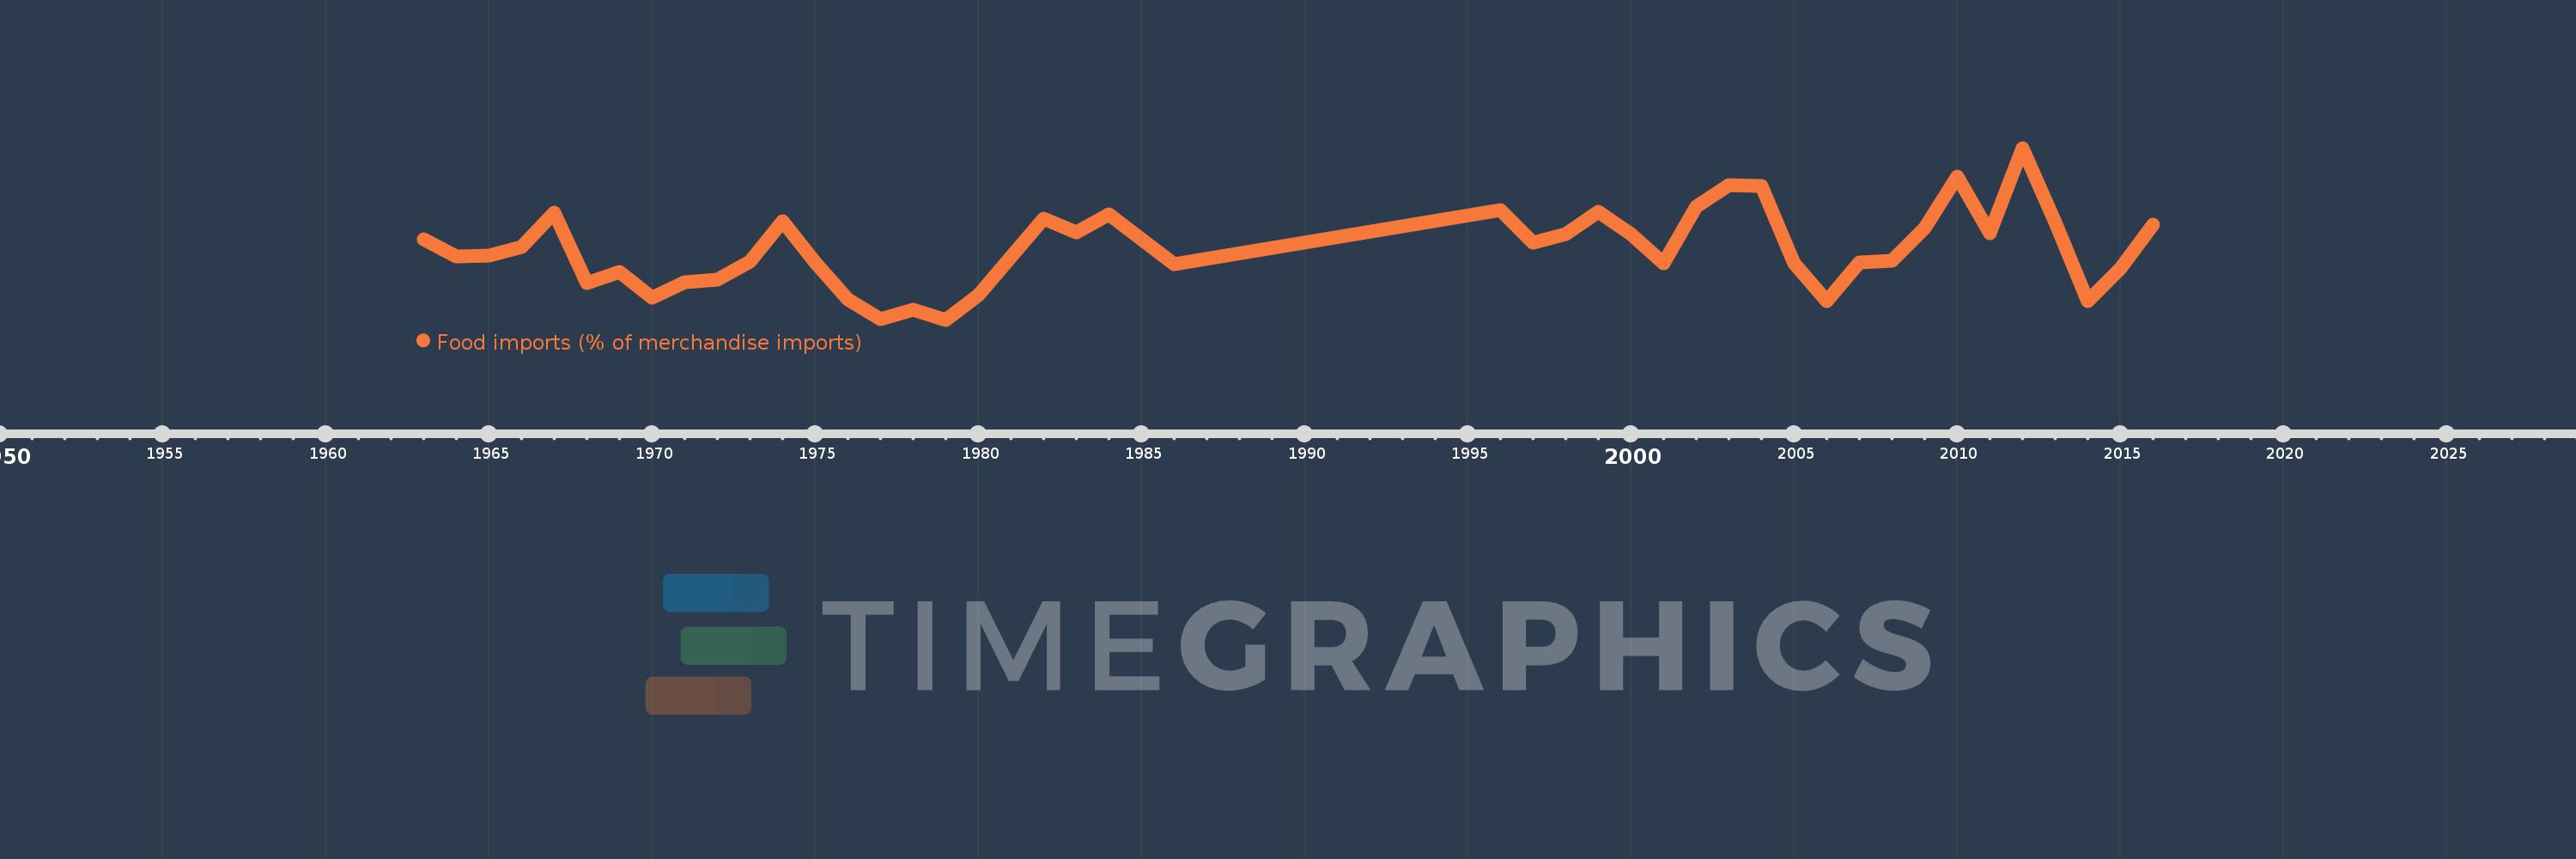
Food imports (% of merchandise imports)
2016,2015,2014,2013,2012,2011,2010,2009,2008,2007,2006,2005,2004,2003,2002,2001,2000,1999,1998,1997,1996,1986,1984,1983,1982,1980,1979,1978,1977,1976,1975,1974,1973,1972,1971,1970,1969,1968,1967,1966,1965,1964,1963
This statistics in other country:
AfghanistanAlbaniaAlgeriaAndorraAngolaAntigua and BarbudaArab WorldArgentinaArmeniaArubaAustraliaAustriaAzerbaijanBahamas, TheBahrainBangladeshBarbadosBelarusBelgiumBelizeBeninBermudaBhutanBoliviaBosnia and HerzegovinaBotswanaBrazilBrunei DarussalamBulgariaBurkina FasoBurundiCabo VerdeCambodiaCameroonCanadaCaribbean small statesCayman IslandsCentral African RepublicCentral Europe and the BalticsChadChileChinaColombiaComorosCongo, Dem. Rep.Congo, Rep.Costa RicaCote d'IvoireCroatiaCubaCyprusCzech RepublicDenmarkDjiboutiDominicaDominican RepublicEarly-demographic dividendEast Asia & PacificEast Asia & Pacific (excluding high income)East Asia & Pacific (IDA & IBRD countries)EcuadorEgypt, Arab Rep.El SalvadorEquatorial GuineaEritreaEstoniaEthiopiaEuro areaEurope & Central AsiaEurope & Central Asia (excluding high income)Europe & Central Asia (IDA & IBRD countries)European UnionFaroe IslandsFijiFinlandFragile and conflict affected situationsFranceFrench PolynesiaGabonGambia, TheGeorgiaGermanyGhanaGreeceGreenlandGrenadaGuatemalaGuineaGuinea-BissauGuyanaHaitiHeavily indebted poor countries (HIPC)High incomeHondurasHong Kong SAR, ChinaHungaryIBRD onlyIcelandIDA & IBRD totalIDA blendIDA onlyIDA totalIndiaIndonesiaIran, Islamic Rep.IraqIrelandIsraelItalyJamaicaJapanJordanKazakhstanKenyaKiribatiKorea, Rep.KuwaitKyrgyz RepublicLao PDRLate-demographic dividendLatin America & Caribbean Latin America & Caribbean (excluding high income)Latin America & the Caribbean (IDA & IBRD countries)LatviaLeast developed countries: UN classificationLebanonLesothoLiberiaLibyaLithuaniaLow & middle incomeLow incomeLower middle incomeLuxembourgMacao SAR, ChinaMacedonia, FYRMadagascarMalawiMalaysiaMaldivesMaliMaltaMauritaniaMauritiusMexicoMiddle East & North AfricaMiddle East & North Africa (excluding high income)Middle East & North Africa (IDA & IBRD countries)Middle incomeMoldovaMongoliaMoroccoMozambiqueMyanmarNamibiaNepalNetherlandsNew CaledoniaNew ZealandNicaraguaNigerNigeriaNorth AmericaNorwayOECD membersOmanOther small statesPacific island small statesPakistanPalauPanamaPapua New GuineaParaguayPeruPhilippinesPolandPortugalPost-demographic dividendPre-demographic dividendQatarRomaniaRussian FederationRwandaSamoaSao Tome and PrincipeSaudi ArabiaSenegalSerbiaSeychellesSierra LeoneSingaporeSlovak RepublicSloveniaSmall statesSolomon IslandsSomaliaSouth AfricaSouth AsiaSouth Asia (IDA & IBRD)SpainSri LankaSt. Kitts and NevisSt. LuciaSt. Vincent and the GrenadinesSub-Saharan Africa Sub-Saharan Africa (excluding high income)Sub-Saharan Africa (IDA & IBRD countries)SudanSurinameSwazilandSwedenSwitzerlandSyrian Arab RepublicTajikistanTanzaniaThailandTimor-LesteTogoTongaTrinidad and TobagoTunisiaTurkeyTurkmenistanTurks and Caicos IslandsTuvaluUgandaUkraineUnited Arab EmiratesUnited KingdomUnited StatesUpper middle incomeUruguayVanuatuVenezuela, RBVietnamVirgin Islands (U.S.)WorldYemen, Rep.ZambiaZimbabwe Timeline:
This timeline shows a graph from 1963 to 2016 of Cote d'Ivoire. No data until 1962. Number of actual observations by date: 43.
Source name:
World Development Indicators
Source organization:
World Bank staff estimates from the Comtrade database maintained by the United Nations Statistics Division.
Categories, topics:
Private Sector, Trade
Last updated:
apr 23, 2017
Indicators value changes by year
Minimum:
13.327
jan 1, 1979
Maximum:
25.127
jan 1, 2012
At the date of observation
Value
Absolute change
Change from previous value
jan 1, 1963
18.86
+18.86
0.0%
jan 1, 1964
17.684
-1.176
-6.24%
jan 1, 1965
17.713
+0.03
0.17%
jan 1, 1966
18.344
+0.631
3.56%
jan 1, 1967
20.7
+2.356
12.84%
jan 1, 1968
15.837
-4.863
-23.49%
jan 1, 1969
16.626
+0.789
4.98%
jan 1, 1970
14.829
-1.797
-10.81%
jan 1, 1971
15.901
+1.072
7.23%
jan 1, 1972
16.071
+0.17
1.07%
jan 1, 1973
17.342
+1.271
7.91%
jan 1, 1974
20.087
+2.745
15.83%
jan 1, 1975
17.251
-2.836
-14.12%
jan 1, 1976
14.705
-2.546
-14.76%
jan 1, 1977
13.366
-1.339
-9.11%
jan 1, 1978
14.007
+0.641
4.8%
jan 1, 1979
13.327
-0.68
-4.85%
jan 1, 1980
15.01
+1.683
12.63%
jan 1, 1982
20.3
+5.29
35.24%
jan 1, 1983
19.317
-0.983
-4.84%
jan 1, 1984
20.589
+1.272
6.59%
jan 1, 1986
17.156
-3.433
-16.67%
jan 1, 1996
20.884
+3.727
21.73%
jan 1, 1997
18.592
-2.292
-10.97%
jan 1, 1998
19.201
+0.609
3.28%
jan 1, 1999
20.754
+1.552
8.08%
jan 1, 2000
19.196
-1.557
-7.5%
jan 1, 2001
17.186
-2.011
-10.47%
jan 1, 2002
21.085
+3.899
22.69%
jan 1, 2003
22.583
+1.498
7.1%
jan 1, 2004
22.491
-0.092
-0.41%
jan 1, 2005
17.198
-5.293
-23.53%
jan 1, 2006
14.621
-2.577
-14.99%
jan 1, 2007
17.283
+2.663
18.21%
jan 1, 2008
17.406
+0.123
0.71%
jan 1, 2009
19.611
+2.205
12.67%
jan 1, 2010
23.174
+3.563
18.17%
jan 1, 2011
19.245
-3.929
-16.96%
jan 1, 2012
25.127
+5.883
30.57%
jan 1, 2013
20.01
-5.117
-20.36%
jan 1, 2014
14.581
-5.43
-27.13%
jan 1, 2015
16.842
+2.261
15.5%
jan 1, 2016
19.834
+2.993
17.77%
Ranking of countries by current statistics by years


Comments: