29
/
en
AIzaSyAYiBZKx7MnpbEhh9jyipgxe19OcubqV5w
April 1, 2024
101064
Canada
CAN
true
2
1
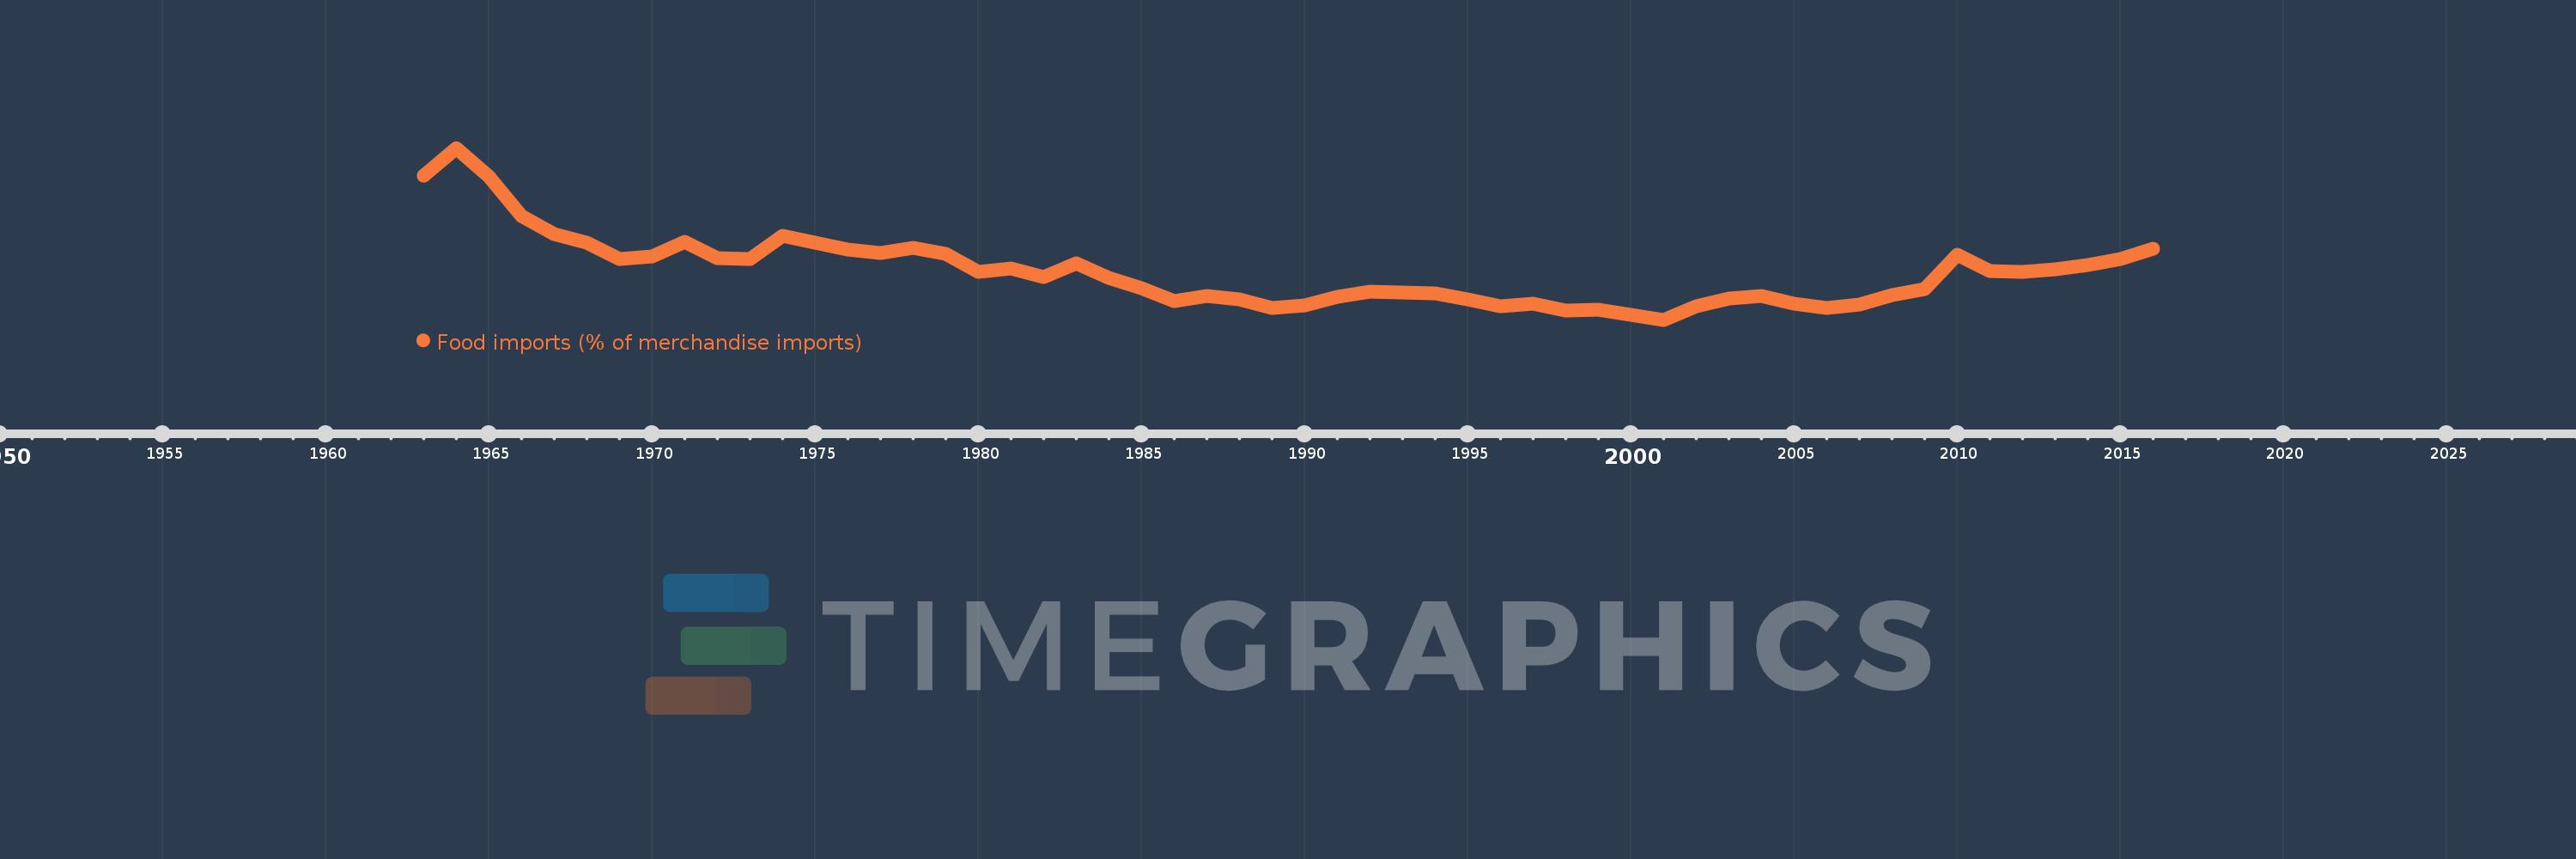
Food imports (% of merchandise imports)
2016,2015,2014,2013,2012,2011,2010,2009,2008,2007,2006,2005,2004,2003,2002,2001,2000,1999,1998,1997,1996,1995,1994,1993,1992,1991,1990,1989,1988,1987,1986,1985,1984,1983,1982,1981,1980,1979,1978,1977,1976,1975,1974,1973,1972,1971,1970,1969,1968,1967,1966,1965,1964,1963
This statistics in other country:
AfghanistanAlbaniaAlgeriaAndorraAngolaAntigua and BarbudaArab WorldArgentinaArmeniaArubaAustraliaAustriaAzerbaijanBahamas, TheBahrainBangladeshBarbadosBelarusBelgiumBelizeBeninBermudaBhutanBoliviaBosnia and HerzegovinaBotswanaBrazilBrunei DarussalamBulgariaBurkina FasoBurundiCabo VerdeCambodiaCameroonCanadaCaribbean small statesCayman IslandsCentral African RepublicCentral Europe and the BalticsChadChileChinaColombiaComorosCongo, Dem. Rep.Congo, Rep.Costa RicaCote d'IvoireCroatiaCubaCyprusCzech RepublicDenmarkDjiboutiDominicaDominican RepublicEarly-demographic dividendEast Asia & PacificEast Asia & Pacific (excluding high income)East Asia & Pacific (IDA & IBRD countries)EcuadorEgypt, Arab Rep.El SalvadorEquatorial GuineaEritreaEstoniaEthiopiaEuro areaEurope & Central AsiaEurope & Central Asia (excluding high income)Europe & Central Asia (IDA & IBRD countries)European UnionFaroe IslandsFijiFinlandFragile and conflict affected situationsFranceFrench PolynesiaGabonGambia, TheGeorgiaGermanyGhanaGreeceGreenlandGrenadaGuatemalaGuineaGuinea-BissauGuyanaHaitiHeavily indebted poor countries (HIPC)High incomeHondurasHong Kong SAR, ChinaHungaryIBRD onlyIcelandIDA & IBRD totalIDA blendIDA onlyIDA totalIndiaIndonesiaIran, Islamic Rep.IraqIrelandIsraelItalyJamaicaJapanJordanKazakhstanKenyaKiribatiKorea, Rep.KuwaitKyrgyz RepublicLao PDRLate-demographic dividendLatin America & Caribbean Latin America & Caribbean (excluding high income)Latin America & the Caribbean (IDA & IBRD countries)LatviaLeast developed countries: UN classificationLebanonLesothoLiberiaLibyaLithuaniaLow & middle incomeLow incomeLower middle incomeLuxembourgMacao SAR, ChinaMacedonia, FYRMadagascarMalawiMalaysiaMaldivesMaliMaltaMauritaniaMauritiusMexicoMiddle East & North AfricaMiddle East & North Africa (excluding high income)Middle East & North Africa (IDA & IBRD countries)Middle incomeMoldovaMongoliaMoroccoMozambiqueMyanmarNamibiaNepalNetherlandsNew CaledoniaNew ZealandNicaraguaNigerNigeriaNorth AmericaNorwayOECD membersOmanOther small statesPacific island small statesPakistanPalauPanamaPapua New GuineaParaguayPeruPhilippinesPolandPortugalPost-demographic dividendPre-demographic dividendQatarRomaniaRussian FederationRwandaSamoaSao Tome and PrincipeSaudi ArabiaSenegalSerbiaSeychellesSierra LeoneSingaporeSlovak RepublicSloveniaSmall statesSolomon IslandsSomaliaSouth AfricaSouth AsiaSouth Asia (IDA & IBRD)SpainSri LankaSt. Kitts and NevisSt. LuciaSt. Vincent and the GrenadinesSub-Saharan Africa Sub-Saharan Africa (excluding high income)Sub-Saharan Africa (IDA & IBRD countries)SudanSurinameSwazilandSwedenSwitzerlandSyrian Arab RepublicTajikistanTanzaniaThailandTimor-LesteTogoTongaTrinidad and TobagoTunisiaTurkeyTurkmenistanTurks and Caicos IslandsTuvaluUgandaUkraineUnited Arab EmiratesUnited KingdomUnited StatesUpper middle incomeUruguayVanuatuVenezuela, RBVietnamVirgin Islands (U.S.)WorldYemen, Rep.ZambiaZimbabwe Timeline:
This timeline shows a graph from 1963 to 2016 of Canada. No data until 1962. Number of actual observations by date: 54.
Source name:
World Development Indicators
Source organization:
World Bank staff estimates from the Comtrade database maintained by the United Nations Statistics Division.
Categories, topics:
Private Sector, Trade
Last updated:
apr 23, 2017
Indicators value changes by year
Maximum:
12.922
jan 1, 1964
At the date of observation
Value
Absolute change
Change from previous value
jan 1, 1963
11.661
+11.661
0.0%
jan 1, 1964
12.922
+1.261
10.81%
jan 1, 1965
11.616
-1.306
-10.11%
jan 1, 1966
9.811
-1.805
-15.54%
jan 1, 1967
9.012
-0.799
-8.14%
jan 1, 1968
8.622
-0.391
-4.34%
jan 1, 1969
7.882
-0.74
-8.58%
jan 1, 1970
7.996
+0.114
1.45%
jan 1, 1971
8.635
+0.64
8.0%
jan 1, 1972
7.922
-0.713
-8.26%
jan 1, 1973
7.851
-0.071
-0.89%
jan 1, 1974
8.94
+1.089
13.87%
jan 1, 1975
8.615
-0.325
-3.64%
jan 1, 1976
8.298
-0.317
-3.68%
jan 1, 1977
8.146
-0.152
-1.83%
jan 1, 1978
8.366
+0.22
2.7%
jan 1, 1979
8.108
-0.258
-3.09%
jan 1, 1980
7.291
-0.816
-10.07%
jan 1, 1981
7.453
+0.161
2.21%
jan 1, 1982
7.029
-0.424
-5.69%
jan 1, 1983
7.685
+0.656
9.33%
jan 1, 1984
7.006
-0.679
-8.84%
jan 1, 1985
6.529
-0.476
-6.8%
jan 1, 1986
5.942
-0.587
-8.99%
jan 1, 1987
6.185
+0.243
4.09%
jan 1, 1988
6.049
-0.136
-2.2%
jan 1, 1989
5.638
-0.412
-6.8%
jan 1, 1990
5.763
+0.126
2.23%
jan 1, 1991
6.144
+0.38
6.6%
jan 1, 1992
6.392
+0.248
4.04%
jan 1, 1993
6.36
-0.032
-0.5%
jan 1, 1994
6.295
-0.064
-1.01%
jan 1, 1995
6.037
-0.258
-4.11%
jan 1, 1996
5.707
-0.33
-5.47%
jan 1, 1997
5.824
+0.117
2.06%
jan 1, 1998
5.54
-0.284
-4.87%
jan 1, 1999
5.57
+0.029
0.53%
jan 1, 2000
5.313
-0.256
-4.6%
jan 1, 2001
5.105
-0.208
-3.92%
jan 1, 2002
5.71
+0.604
11.84%
jan 1, 2003
6.069
+0.359
6.3%
jan 1, 2004
6.206
+0.137
2.26%
jan 1, 2005
5.829
-0.378
-6.09%
jan 1, 2006
5.659
-0.169
-2.91%
jan 1, 2007
5.806
+0.147
2.59%
jan 1, 2008
6.223
+0.417
7.19%
jan 1, 2009
6.517
+0.294
4.72%
jan 1, 2010
8.052
+1.535
23.55%
jan 1, 2011
7.331
-0.721
-8.96%
jan 1, 2012
7.288
-0.043
-0.59%
jan 1, 2013
7.406
+0.119
1.63%
jan 1, 2014
7.609
+0.202
2.73%
jan 1, 2015
7.851
+0.242
3.19%
jan 1, 2016
8.318
+0.467
5.95%
Ranking of countries by current statistics by years


Comments: