29
/
en
AIzaSyAYiBZKx7MnpbEhh9jyipgxe19OcubqV5w
April 1, 2024
57032
South Asia
SAS
false
2
1
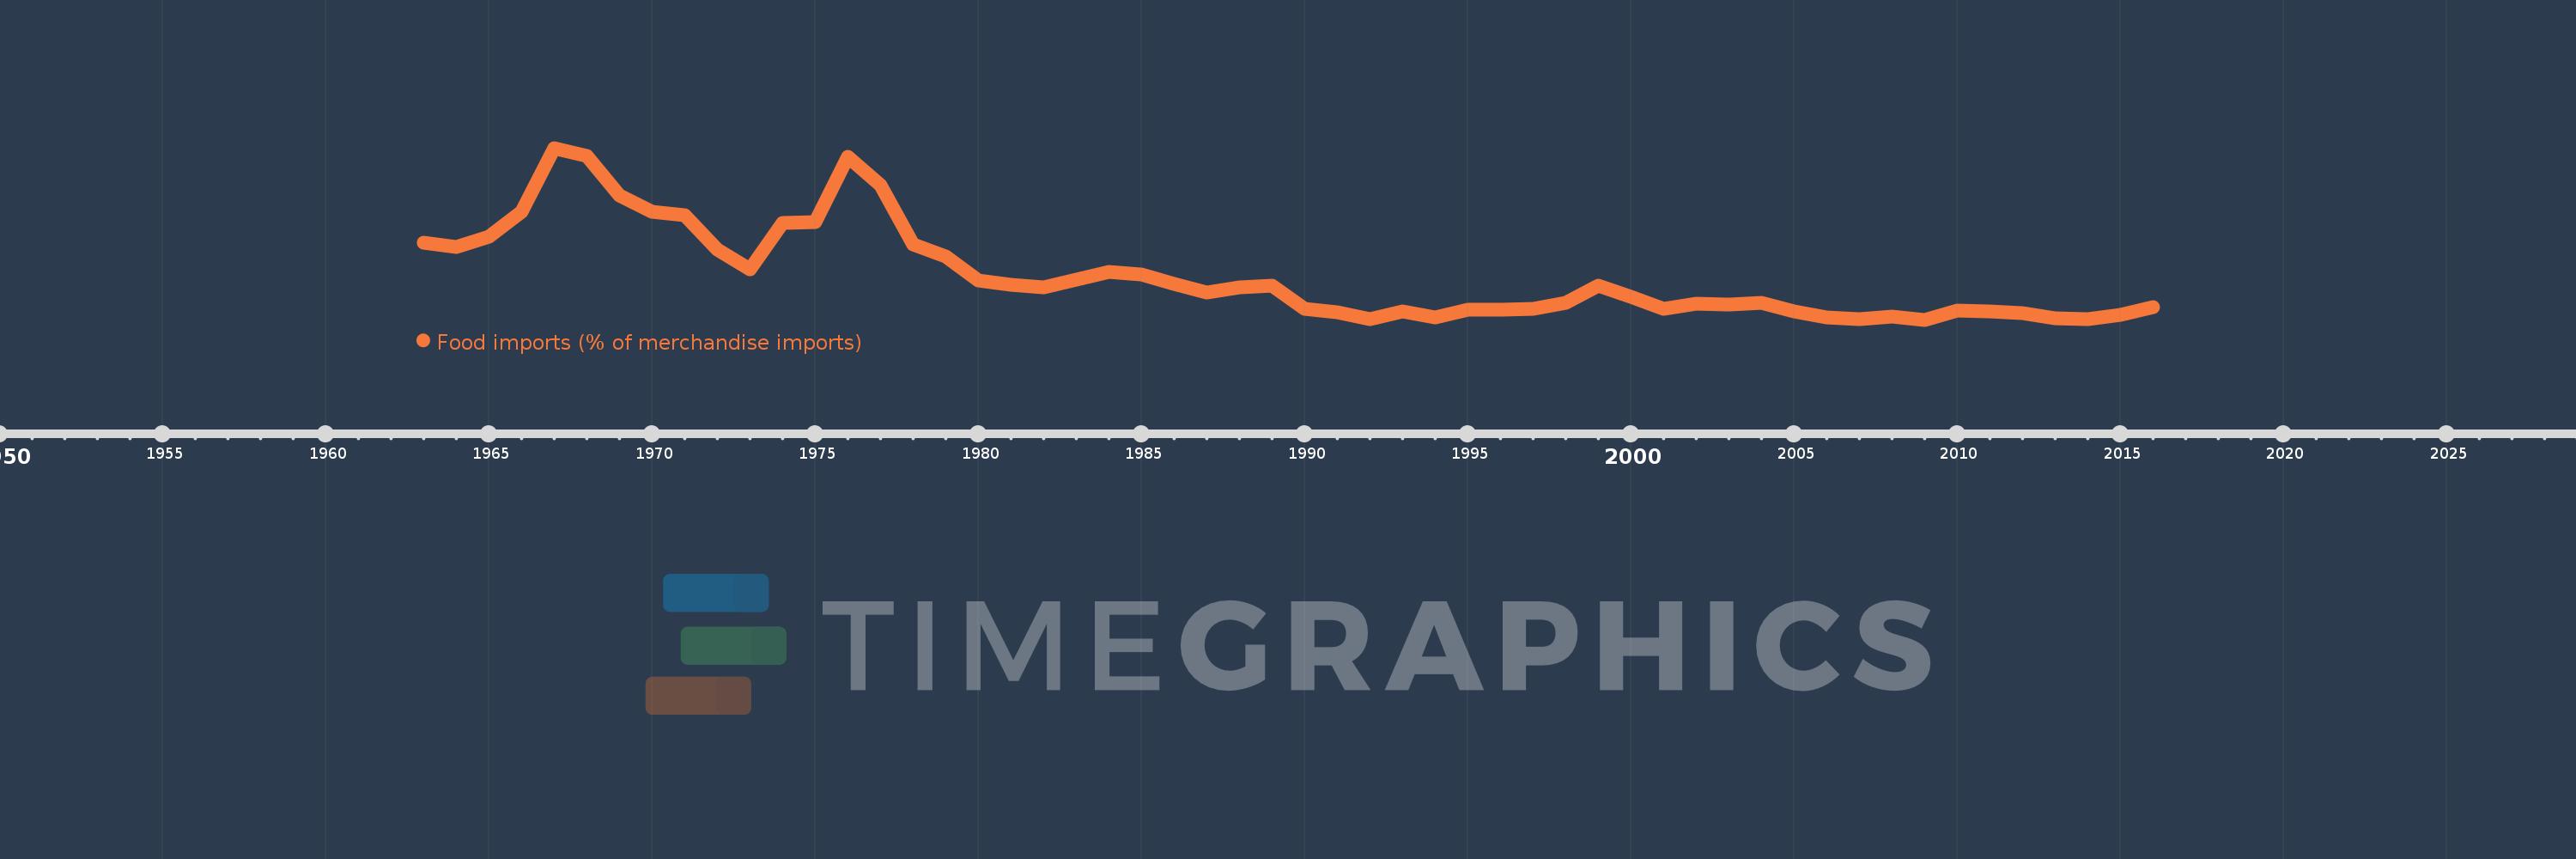
Food imports (% of merchandise imports)
2016,2015,2014,2013,2012,2011,2010,2009,2008,2007,2006,2005,2004,2003,2002,2001,2000,1999,1998,1997,1996,1995,1994,1993,1992,1991,1990,1989,1988,1987,1986,1985,1984,1982,1981,1980,1979,1978,1977,1976,1975,1974,1973,1972,1971,1970,1969,1968,1967,1966,1965,1964,1963
This statistics in other country:
AfghanistanAlbaniaAlgeriaAndorraAngolaAntigua and BarbudaArab WorldArgentinaArmeniaArubaAustraliaAustriaAzerbaijanBahamas, TheBahrainBangladeshBarbadosBelarusBelgiumBelizeBeninBermudaBhutanBoliviaBosnia and HerzegovinaBotswanaBrazilBrunei DarussalamBulgariaBurkina FasoBurundiCabo VerdeCambodiaCameroonCanadaCaribbean small statesCayman IslandsCentral African RepublicCentral Europe and the BalticsChadChileChinaColombiaComorosCongo, Dem. Rep.Congo, Rep.Costa RicaCote d'IvoireCroatiaCubaCyprusCzech RepublicDenmarkDjiboutiDominicaDominican RepublicEarly-demographic dividendEast Asia & PacificEast Asia & Pacific (excluding high income)East Asia & Pacific (IDA & IBRD countries)EcuadorEgypt, Arab Rep.El SalvadorEquatorial GuineaEritreaEstoniaEthiopiaEuro areaEurope & Central AsiaEurope & Central Asia (excluding high income)Europe & Central Asia (IDA & IBRD countries)European UnionFaroe IslandsFijiFinlandFragile and conflict affected situationsFranceFrench PolynesiaGabonGambia, TheGeorgiaGermanyGhanaGreeceGreenlandGrenadaGuatemalaGuineaGuinea-BissauGuyanaHaitiHeavily indebted poor countries (HIPC)High incomeHondurasHong Kong SAR, ChinaHungaryIBRD onlyIcelandIDA & IBRD totalIDA blendIDA onlyIDA totalIndiaIndonesiaIran, Islamic Rep.IraqIrelandIsraelItalyJamaicaJapanJordanKazakhstanKenyaKiribatiKorea, Rep.KuwaitKyrgyz RepublicLao PDRLate-demographic dividendLatin America & Caribbean Latin America & Caribbean (excluding high income)Latin America & the Caribbean (IDA & IBRD countries)LatviaLeast developed countries: UN classificationLebanonLesothoLiberiaLibyaLithuaniaLow & middle incomeLow incomeLower middle incomeLuxembourgMacao SAR, ChinaMacedonia, FYRMadagascarMalawiMalaysiaMaldivesMaliMaltaMauritaniaMauritiusMexicoMiddle East & North AfricaMiddle East & North Africa (excluding high income)Middle East & North Africa (IDA & IBRD countries)Middle incomeMoldovaMongoliaMoroccoMozambiqueMyanmarNamibiaNepalNetherlandsNew CaledoniaNew ZealandNicaraguaNigerNigeriaNorth AmericaNorwayOECD membersOmanOther small statesPacific island small statesPakistanPalauPanamaPapua New GuineaParaguayPeruPhilippinesPolandPortugalPost-demographic dividendPre-demographic dividendQatarRomaniaRussian FederationRwandaSamoaSao Tome and PrincipeSaudi ArabiaSenegalSerbiaSeychellesSierra LeoneSingaporeSlovak RepublicSloveniaSmall statesSolomon IslandsSomaliaSouth AfricaSouth AsiaSouth Asia (IDA & IBRD)SpainSri LankaSt. Kitts and NevisSt. LuciaSt. Vincent and the GrenadinesSub-Saharan Africa Sub-Saharan Africa (excluding high income)Sub-Saharan Africa (IDA & IBRD countries)SudanSurinameSwazilandSwedenSwitzerlandSyrian Arab RepublicTajikistanTanzaniaThailandTimor-LesteTogoTongaTrinidad and TobagoTunisiaTurkeyTurkmenistanTurks and Caicos IslandsTuvaluUgandaUkraineUnited Arab EmiratesUnited KingdomUnited StatesUpper middle incomeUruguayVanuatuVenezuela, RBVietnamVirgin Islands (U.S.)WorldYemen, Rep.ZambiaZimbabwe Timeline:
This timeline shows a graph from 1963 to 2016 of South Asia. No data until 1962. Number of actual observations by date: 53.
Source name:
World Development Indicators
Source organization:
World Bank staff estimates from the Comtrade database maintained by the United Nations Statistics Division.
Categories, topics:
Private Sector, Trade
Last updated:
apr 23, 2017
Indicators value changes by year
Maximum:
32.725
jan 1, 1967
At the date of observation
Value
Absolute change
Change from previous value
jan 1, 1963
17.428
+17.428
0.0%
jan 1, 1964
16.732
-0.696
-3.99%
jan 1, 1965
18.36
+1.628
9.73%
jan 1, 1966
22.419
+4.059
22.11%
jan 1, 1967
32.725
+10.306
45.97%
jan 1, 1968
31.415
-1.31
-4.0%
jan 1, 1969
25.069
-6.346
-20.2%
jan 1, 1970
22.361
-2.707
-10.8%
jan 1, 1971
21.784
-0.578
-2.58%
jan 1, 1972
16.207
-5.577
-25.6%
jan 1, 1973
13.013
-3.194
-19.71%
jan 1, 1974
20.582
+7.57
58.17%
jan 1, 1975
20.787
+0.205
1.0%
jan 1, 1976
31.246
+10.458
50.31%
jan 1, 1977
26.759
-4.487
-14.36%
jan 1, 1978
17.116
-9.642
-36.03%
jan 1, 1979
15.177
-1.939
-11.33%
jan 1, 1980
11.315
-3.862
-25.45%
jan 1, 1981
10.575
-0.74
-6.54%
jan 1, 1982
10.114
-0.461
-4.36%
jan 1, 1984
12.62
+2.506
24.78%
jan 1, 1985
12.196
-0.424
-3.36%
jan 1, 1986
10.765
-1.431
-11.74%
jan 1, 1987
9.281
-1.483
-13.78%
jan 1, 1988
10.138
+0.857
9.24%
jan 1, 1989
10.458
+0.32
3.16%
jan 1, 1990
6.725
-3.733
-35.69%
jan 1, 1991
6.102
-0.623
-9.27%
jan 1, 1992
5.047
-1.055
-17.29%
jan 1, 1993
6.209
+1.163
23.04%
jan 1, 1994
5.345
-0.864
-13.92%
jan 1, 1995
6.515
+1.17
21.88%
jan 1, 1996
6.514
0.0
0.0%
jan 1, 1997
6.601
+0.087
1.33%
jan 1, 1998
7.703
+1.102
16.7%
jan 1, 1999
10.482
+2.779
36.07%
jan 1, 2000
8.583
-1.899
-18.12%
jan 1, 2001
6.642
-1.941
-22.61%
jan 1, 2002
7.455
+0.813
12.24%
jan 1, 2003
7.293
-0.162
-2.18%
jan 1, 2004
7.657
+0.364
4.99%
jan 1, 2005
6.217
-1.439
-18.8%
jan 1, 2006
5.263
-0.954
-15.35%
jan 1, 2007
4.929
-0.334
-6.34%
jan 1, 2008
5.463
+0.533
10.82%
jan 1, 2009
4.9
-0.562
-10.29%
jan 1, 2010
6.447
+1.547
31.57%
jan 1, 2011
6.223
-0.225
-3.48%
jan 1, 2012
6.037
-0.185
-2.98%
jan 1, 2013
5.174
-0.863
-14.3%
jan 1, 2014
5.035
-0.139
-2.69%
jan 1, 2015
5.693
+0.658
13.07%
jan 1, 2016
6.947
+1.255
22.04%
Ranking of countries by current statistics by years


Comments: