29
/
en
AIzaSyAYiBZKx7MnpbEhh9jyipgxe19OcubqV5w
April 1, 2024
247523
Spain
ESP
true
2
1
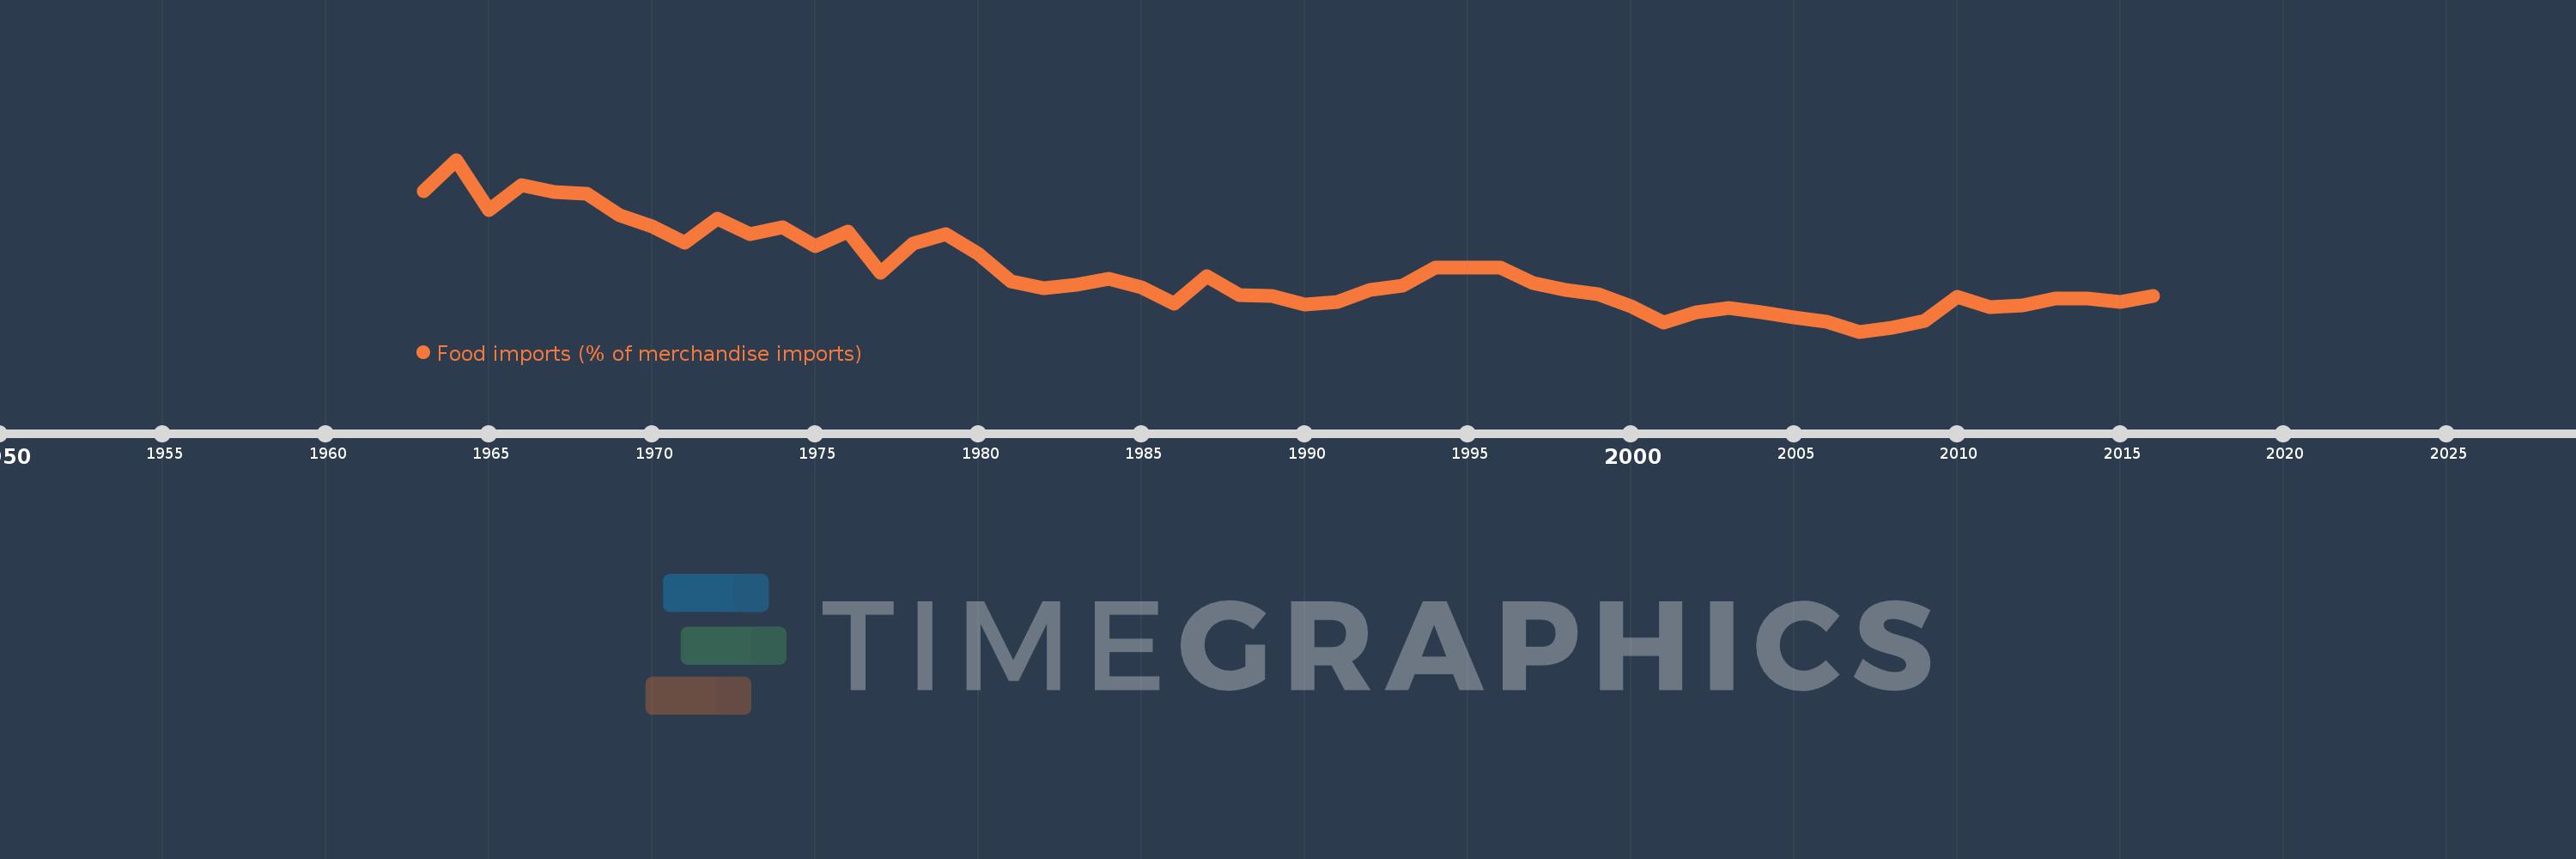
Food imports (% of merchandise imports)
2016,2015,2014,2013,2012,2011,2010,2009,2008,2007,2006,2005,2004,2003,2002,2001,2000,1999,1998,1997,1996,1995,1994,1993,1992,1991,1990,1989,1988,1987,1986,1985,1984,1983,1982,1981,1980,1979,1978,1977,1976,1975,1974,1973,1972,1971,1970,1969,1968,1967,1966,1965,1964,1963
This statistics in other country:
AfghanistanAlbaniaAlgeriaAndorraAngolaAntigua and BarbudaArab WorldArgentinaArmeniaArubaAustraliaAustriaAzerbaijanBahamas, TheBahrainBangladeshBarbadosBelarusBelgiumBelizeBeninBermudaBhutanBoliviaBosnia and HerzegovinaBotswanaBrazilBrunei DarussalamBulgariaBurkina FasoBurundiCabo VerdeCambodiaCameroonCanadaCaribbean small statesCayman IslandsCentral African RepublicCentral Europe and the BalticsChadChileChinaColombiaComorosCongo, Dem. Rep.Congo, Rep.Costa RicaCote d'IvoireCroatiaCubaCyprusCzech RepublicDenmarkDjiboutiDominicaDominican RepublicEarly-demographic dividendEast Asia & PacificEast Asia & Pacific (excluding high income)East Asia & Pacific (IDA & IBRD countries)EcuadorEgypt, Arab Rep.El SalvadorEquatorial GuineaEritreaEstoniaEthiopiaEuro areaEurope & Central AsiaEurope & Central Asia (excluding high income)Europe & Central Asia (IDA & IBRD countries)European UnionFaroe IslandsFijiFinlandFragile and conflict affected situationsFranceFrench PolynesiaGabonGambia, TheGeorgiaGermanyGhanaGreeceGreenlandGrenadaGuatemalaGuineaGuinea-BissauGuyanaHaitiHeavily indebted poor countries (HIPC)High incomeHondurasHong Kong SAR, ChinaHungaryIBRD onlyIcelandIDA & IBRD totalIDA blendIDA onlyIDA totalIndiaIndonesiaIran, Islamic Rep.IraqIrelandIsraelItalyJamaicaJapanJordanKazakhstanKenyaKiribatiKorea, Rep.KuwaitKyrgyz RepublicLao PDRLate-demographic dividendLatin America & Caribbean Latin America & Caribbean (excluding high income)Latin America & the Caribbean (IDA & IBRD countries)LatviaLeast developed countries: UN classificationLebanonLesothoLiberiaLibyaLithuaniaLow & middle incomeLow incomeLower middle incomeLuxembourgMacao SAR, ChinaMacedonia, FYRMadagascarMalawiMalaysiaMaldivesMaliMaltaMauritaniaMauritiusMexicoMiddle East & North AfricaMiddle East & North Africa (excluding high income)Middle East & North Africa (IDA & IBRD countries)Middle incomeMoldovaMongoliaMoroccoMozambiqueMyanmarNamibiaNepalNetherlandsNew CaledoniaNew ZealandNicaraguaNigerNigeriaNorth AmericaNorwayOECD membersOmanOther small statesPacific island small statesPakistanPalauPanamaPapua New GuineaParaguayPeruPhilippinesPolandPortugalPost-demographic dividendPre-demographic dividendQatarRomaniaRussian FederationRwandaSamoaSao Tome and PrincipeSaudi ArabiaSenegalSerbiaSeychellesSierra LeoneSingaporeSlovak RepublicSloveniaSmall statesSolomon IslandsSomaliaSouth AfricaSouth AsiaSouth Asia (IDA & IBRD)SpainSri LankaSt. Kitts and NevisSt. LuciaSt. Vincent and the GrenadinesSub-Saharan Africa Sub-Saharan Africa (excluding high income)Sub-Saharan Africa (IDA & IBRD countries)SudanSurinameSwazilandSwedenSwitzerlandSyrian Arab RepublicTajikistanTanzaniaThailandTimor-LesteTogoTongaTrinidad and TobagoTunisiaTurkeyTurkmenistanTurks and Caicos IslandsTuvaluUgandaUkraineUnited Arab EmiratesUnited KingdomUnited StatesUpper middle incomeUruguayVanuatuVenezuela, RBVietnamVirgin Islands (U.S.)WorldYemen, Rep.ZambiaZimbabwe Timeline:
This timeline shows a graph from 1963 to 2016 of Spain. No data until 1962. Number of actual observations by date: 54.
Source name:
World Development Indicators
Source organization:
World Bank staff estimates from the Comtrade database maintained by the United Nations Statistics Division.
Categories, topics:
Private Sector, Trade
Last updated:
apr 23, 2017
Indicators value changes by year
Maximum:
22.365
jan 1, 1964
At the date of observation
Value
Absolute change
Change from previous value
jan 1, 1963
19.813
+19.813
0.0%
jan 1, 1964
22.365
+2.551
12.88%
jan 1, 1965
18.284
-4.081
-18.25%
jan 1, 1966
20.285
+2.001
10.94%
jan 1, 1967
19.74
-0.545
-2.68%
jan 1, 1968
19.617
-0.123
-0.62%
jan 1, 1969
17.898
-1.719
-8.76%
jan 1, 1970
16.944
-0.955
-5.33%
jan 1, 1971
15.648
-1.295
-7.64%
jan 1, 1972
17.56
+1.912
12.22%
jan 1, 1973
16.309
-1.251
-7.12%
jan 1, 1974
16.898
+0.589
3.61%
jan 1, 1975
15.323
-1.575
-9.32%
jan 1, 1976
16.553
+1.23
8.03%
jan 1, 1977
13.182
-3.372
-20.37%
jan 1, 1978
15.544
+2.362
17.92%
jan 1, 1979
16.348
+0.805
5.18%
jan 1, 1980
14.699
-1.649
-10.09%
jan 1, 1981
12.509
-2.191
-14.9%
jan 1, 1982
11.9
-0.609
-4.87%
jan 1, 1983
12.194
+0.294
2.47%
jan 1, 1984
12.725
+0.532
4.36%
jan 1, 1985
12.015
-0.71
-5.58%
jan 1, 1986
10.642
-1.373
-11.43%
jan 1, 1987
12.915
+2.273
21.36%
jan 1, 1988
11.373
-1.542
-11.94%
jan 1, 1989
11.331
-0.043
-0.38%
jan 1, 1990
10.636
-0.695
-6.13%
jan 1, 1991
10.79
+0.154
1.45%
jan 1, 1992
11.798
+1.009
9.35%
jan 1, 1993
12.14
+0.342
2.9%
jan 1, 1994
13.577
+1.437
11.83%
jan 1, 1995
13.636
+0.059
0.43%
jan 1, 1996
13.635
0.0
0.0%
jan 1, 1997
12.326
-1.309
-9.6%
jan 1, 1998
11.779
-0.547
-4.44%
jan 1, 1999
11.437
-0.342
-2.9%
jan 1, 2000
10.443
-0.993
-8.69%
jan 1, 2001
9.155
-1.288
-12.33%
jan 1, 2002
9.996
+0.84
9.18%
jan 1, 2003
10.3
+0.304
3.04%
jan 1, 2004
9.98
-0.32
-3.11%
jan 1, 2005
9.539
-0.441
-4.42%
jan 1, 2006
9.224
-0.314
-3.29%
jan 1, 2007
8.406
-0.818
-8.87%
jan 1, 2008
8.723
+0.317
3.77%
jan 1, 2009
9.252
+0.529
6.07%
jan 1, 2010
11.25
+1.998
21.6%
jan 1, 2011
10.419
-0.831
-7.38%
jan 1, 2012
10.531
+0.112
1.08%
jan 1, 2013
11.097
+0.565
5.37%
jan 1, 2014
11.087
-0.01
-0.09%
jan 1, 2015
10.798
-0.288
-2.6%
jan 1, 2016
11.292
+0.494
4.57%
Ranking of countries by current statistics by years


Comments: