29
/
en
AIzaSyAYiBZKx7MnpbEhh9jyipgxe19OcubqV5w
April 1, 2024
248690
Sri Lanka
LKA
true
2
1
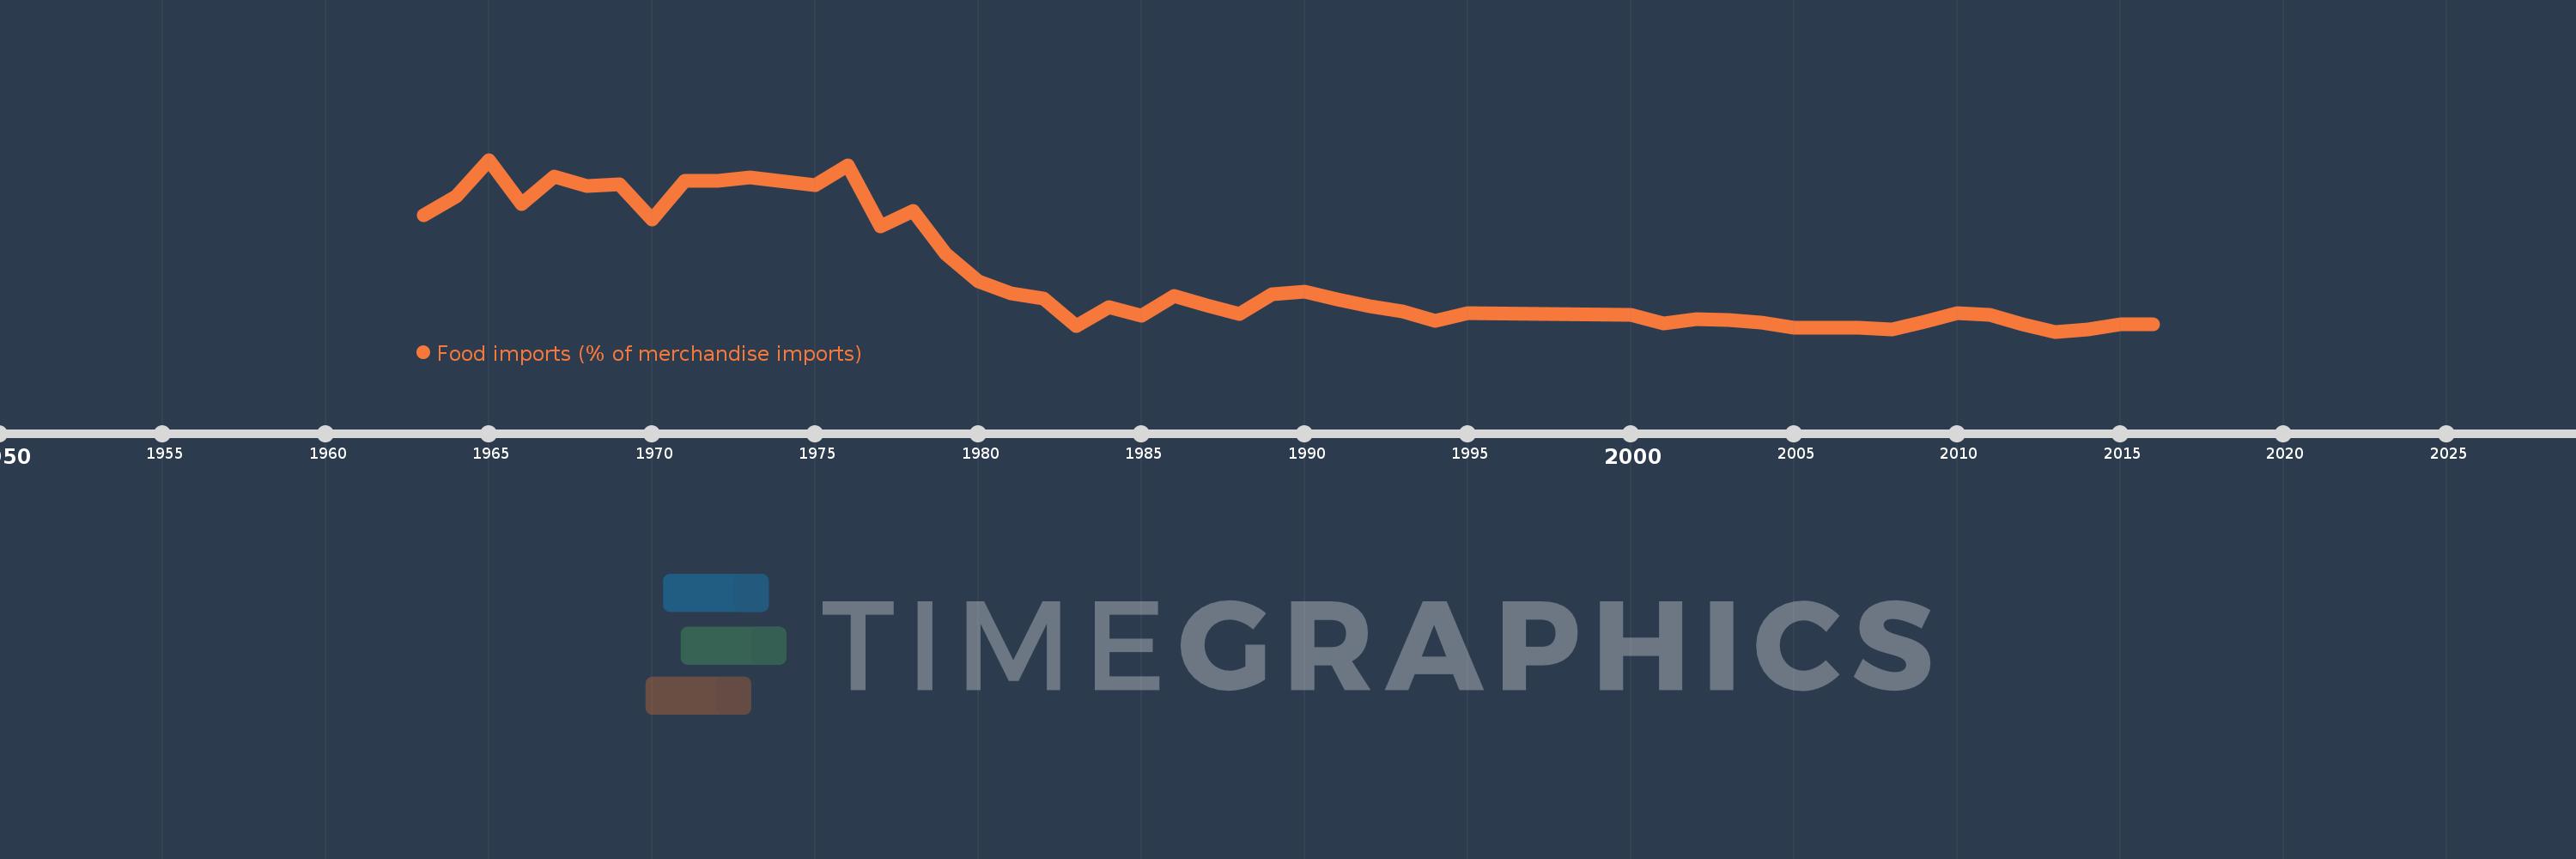
Food imports (% of merchandise imports)
2016,2015,2014,2013,2012,2011,2010,2009,2008,2007,2006,2005,2004,2003,2002,2001,2000,1995,1994,1993,1992,1991,1990,1989,1988,1987,1986,1985,1984,1983,1982,1981,1980,1979,1978,1977,1976,1975,1973,1972,1971,1970,1969,1968,1967,1966,1965,1964,1963
This statistics in other country:
AfghanistanAlbaniaAlgeriaAndorraAngolaAntigua and BarbudaArab WorldArgentinaArmeniaArubaAustraliaAustriaAzerbaijanBahamas, TheBahrainBangladeshBarbadosBelarusBelgiumBelizeBeninBermudaBhutanBoliviaBosnia and HerzegovinaBotswanaBrazilBrunei DarussalamBulgariaBurkina FasoBurundiCabo VerdeCambodiaCameroonCanadaCaribbean small statesCayman IslandsCentral African RepublicCentral Europe and the BalticsChadChileChinaColombiaComorosCongo, Dem. Rep.Congo, Rep.Costa RicaCote d'IvoireCroatiaCubaCyprusCzech RepublicDenmarkDjiboutiDominicaDominican RepublicEarly-demographic dividendEast Asia & PacificEast Asia & Pacific (excluding high income)East Asia & Pacific (IDA & IBRD countries)EcuadorEgypt, Arab Rep.El SalvadorEquatorial GuineaEritreaEstoniaEthiopiaEuro areaEurope & Central AsiaEurope & Central Asia (excluding high income)Europe & Central Asia (IDA & IBRD countries)European UnionFaroe IslandsFijiFinlandFragile and conflict affected situationsFranceFrench PolynesiaGabonGambia, TheGeorgiaGermanyGhanaGreeceGreenlandGrenadaGuatemalaGuineaGuinea-BissauGuyanaHaitiHeavily indebted poor countries (HIPC)High incomeHondurasHong Kong SAR, ChinaHungaryIBRD onlyIcelandIDA & IBRD totalIDA blendIDA onlyIDA totalIndiaIndonesiaIran, Islamic Rep.IraqIrelandIsraelItalyJamaicaJapanJordanKazakhstanKenyaKiribatiKorea, Rep.KuwaitKyrgyz RepublicLao PDRLate-demographic dividendLatin America & Caribbean Latin America & Caribbean (excluding high income)Latin America & the Caribbean (IDA & IBRD countries)LatviaLeast developed countries: UN classificationLebanonLesothoLiberiaLibyaLithuaniaLow & middle incomeLow incomeLower middle incomeLuxembourgMacao SAR, ChinaMacedonia, FYRMadagascarMalawiMalaysiaMaldivesMaliMaltaMauritaniaMauritiusMexicoMiddle East & North AfricaMiddle East & North Africa (excluding high income)Middle East & North Africa (IDA & IBRD countries)Middle incomeMoldovaMongoliaMoroccoMozambiqueMyanmarNamibiaNepalNetherlandsNew CaledoniaNew ZealandNicaraguaNigerNigeriaNorth AmericaNorwayOECD membersOmanOther small statesPacific island small statesPakistanPalauPanamaPapua New GuineaParaguayPeruPhilippinesPolandPortugalPost-demographic dividendPre-demographic dividendQatarRomaniaRussian FederationRwandaSamoaSao Tome and PrincipeSaudi ArabiaSenegalSerbiaSeychellesSierra LeoneSingaporeSlovak RepublicSloveniaSmall statesSolomon IslandsSomaliaSouth AfricaSouth AsiaSouth Asia (IDA & IBRD)SpainSri LankaSt. Kitts and NevisSt. LuciaSt. Vincent and the GrenadinesSub-Saharan Africa Sub-Saharan Africa (excluding high income)Sub-Saharan Africa (IDA & IBRD countries)SudanSurinameSwazilandSwedenSwitzerlandSyrian Arab RepublicTajikistanTanzaniaThailandTimor-LesteTogoTongaTrinidad and TobagoTunisiaTurkeyTurkmenistanTurks and Caicos IslandsTuvaluUgandaUkraineUnited Arab EmiratesUnited KingdomUnited StatesUpper middle incomeUruguayVanuatuVenezuela, RBVietnamVirgin Islands (U.S.)WorldYemen, Rep.ZambiaZimbabwe Timeline:
This timeline shows a graph from 1963 to 2016 of Sri Lanka. No data until 1962. Number of actual observations by date: 49.
Source name:
World Development Indicators
Source organization:
World Bank staff estimates from the Comtrade database maintained by the United Nations Statistics Division.
Categories, topics:
Private Sector, Trade
Last updated:
apr 23, 2017
Indicators value changes by year
Minimum:
11.502
jan 1, 2013
Maximum:
51.823
jan 1, 1965
At the date of observation
Value
Absolute change
Change from previous value
jan 1, 1963
38.739
+38.739
0.0%
jan 1, 1964
43.248
+4.509
11.64%
jan 1, 1965
51.823
+8.575
19.83%
jan 1, 1966
41.407
-10.416
-20.1%
jan 1, 1967
47.863
+6.456
15.59%
jan 1, 1968
45.652
-2.211
-4.62%
jan 1, 1969
46.102
+0.449
0.98%
jan 1, 1970
37.814
-8.288
-17.98%
jan 1, 1971
46.98
+9.167
24.24%
jan 1, 1972
46.853
-0.127
-0.27%
jan 1, 1973
47.682
+0.828
1.77%
jan 1, 1975
45.952
-1.73
-3.63%
jan 1, 1976
50.458
+4.506
9.81%
jan 1, 1977
36.279
-14.18
-28.1%
jan 1, 1978
39.83
+3.551
9.79%
jan 1, 1979
29.706
-10.124
-25.42%
jan 1, 1980
23.314
-6.391
-21.52%
jan 1, 1981
20.397
-2.917
-12.51%
jan 1, 1982
19.359
-1.039
-5.09%
jan 1, 1983
12.823
-6.535
-33.76%
jan 1, 1984
17.175
+4.352
33.94%
jan 1, 1985
15.28
-1.895
-11.03%
jan 1, 1986
19.961
+4.68
30.63%
jan 1, 1987
17.735
-2.226
-11.15%
jan 1, 1988
15.601
-2.134
-12.03%
jan 1, 1989
20.273
+4.672
29.95%
jan 1, 1990
20.835
+0.562
2.77%
jan 1, 1991
19.063
-1.772
-8.51%
jan 1, 1992
17.477
-1.586
-8.32%
jan 1, 1993
16.24
-1.237
-7.08%
jan 1, 1994
13.93
-2.31
-14.22%
jan 1, 1995
15.884
+1.954
14.03%
jan 1, 2000
15.34
-0.544
-3.42%
jan 1, 2001
13.334
-2.006
-13.08%
jan 1, 2002
14.36
+1.026
7.69%
jan 1, 2003
14.239
-0.122
-0.85%
jan 1, 2004
13.619
-0.62
-4.35%
jan 1, 2005
12.315
-1.304
-9.57%
jan 1, 2006
12.46
+0.144
1.17%
jan 1, 2007
12.35
-0.11
-0.88%
jan 1, 2008
11.917
-0.433
-3.5%
jan 1, 2009
13.866
+1.949
16.36%
jan 1, 2010
15.746
+1.879
13.55%
jan 1, 2011
15.351
-0.395
-2.51%
jan 1, 2012
13.298
-2.052
-13.37%
jan 1, 2013
11.502
-1.796
-13.5%
jan 1, 2014
12.098
+0.596
5.18%
jan 1, 2015
13.21
+1.112
9.19%
jan 1, 2016
13.15
-0.061
-0.46%
Ranking of countries by current statistics by years


Comments: