29
/
en
AIzaSyAYiBZKx7MnpbEhh9jyipgxe19OcubqV5w
April 1, 2024
123472
Ecuador
ECU
true
2
1
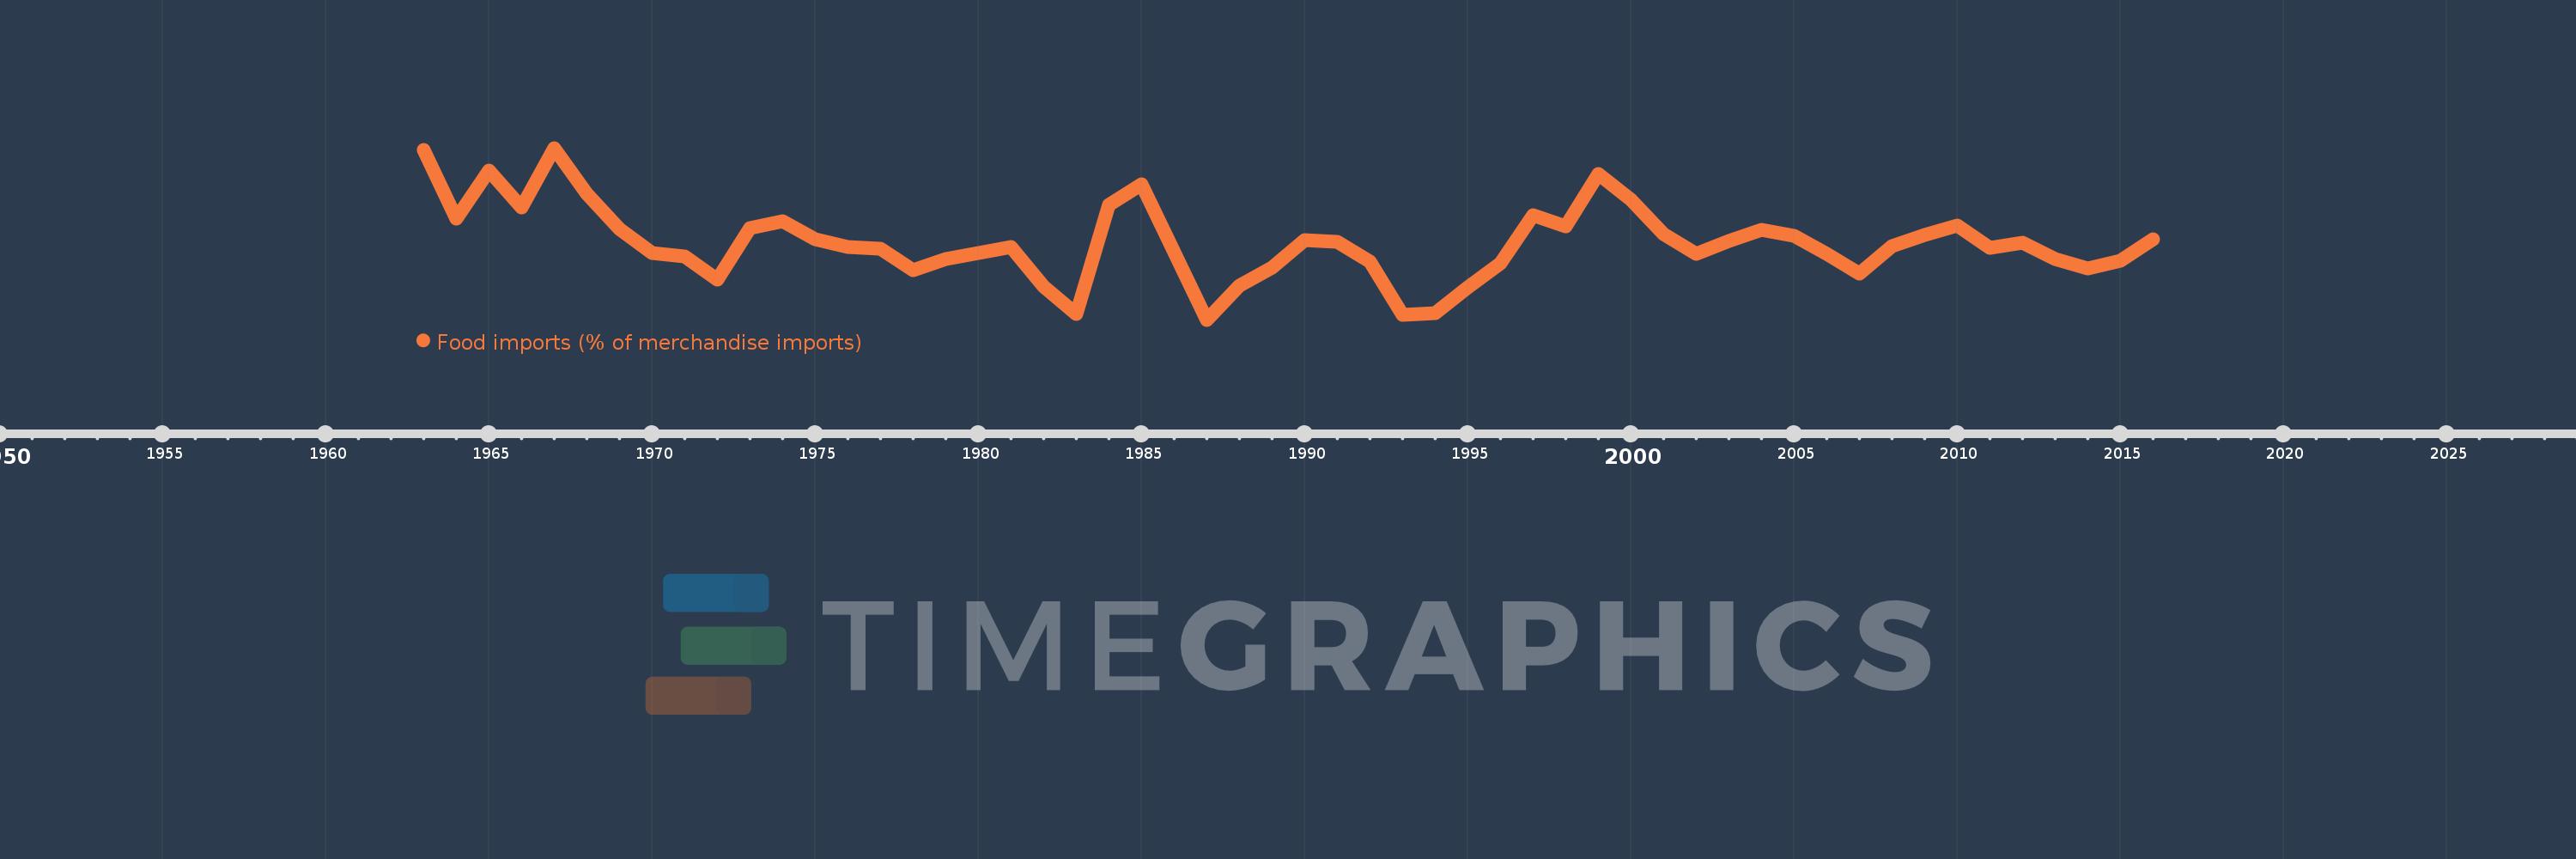
Food imports (% of merchandise imports)
2016,2015,2014,2013,2012,2011,2010,2009,2008,2007,2006,2005,2004,2003,2002,2001,2000,1999,1998,1997,1996,1995,1994,1993,1992,1991,1990,1989,1988,1987,1986,1985,1984,1983,1982,1981,1979,1978,1977,1976,1975,1974,1973,1972,1971,1970,1969,1968,1967,1966,1965,1964,1963
This statistics in other country:
AfghanistanAlbaniaAlgeriaAndorraAngolaAntigua and BarbudaArab WorldArgentinaArmeniaArubaAustraliaAustriaAzerbaijanBahamas, TheBahrainBangladeshBarbadosBelarusBelgiumBelizeBeninBermudaBhutanBoliviaBosnia and HerzegovinaBotswanaBrazilBrunei DarussalamBulgariaBurkina FasoBurundiCabo VerdeCambodiaCameroonCanadaCaribbean small statesCayman IslandsCentral African RepublicCentral Europe and the BalticsChadChileChinaColombiaComorosCongo, Dem. Rep.Congo, Rep.Costa RicaCote d'IvoireCroatiaCubaCyprusCzech RepublicDenmarkDjiboutiDominicaDominican RepublicEarly-demographic dividendEast Asia & PacificEast Asia & Pacific (excluding high income)East Asia & Pacific (IDA & IBRD countries)EcuadorEgypt, Arab Rep.El SalvadorEquatorial GuineaEritreaEstoniaEthiopiaEuro areaEurope & Central AsiaEurope & Central Asia (excluding high income)Europe & Central Asia (IDA & IBRD countries)European UnionFaroe IslandsFijiFinlandFragile and conflict affected situationsFranceFrench PolynesiaGabonGambia, TheGeorgiaGermanyGhanaGreeceGreenlandGrenadaGuatemalaGuineaGuinea-BissauGuyanaHaitiHeavily indebted poor countries (HIPC)High incomeHondurasHong Kong SAR, ChinaHungaryIBRD onlyIcelandIDA & IBRD totalIDA blendIDA onlyIDA totalIndiaIndonesiaIran, Islamic Rep.IraqIrelandIsraelItalyJamaicaJapanJordanKazakhstanKenyaKiribatiKorea, Rep.KuwaitKyrgyz RepublicLao PDRLate-demographic dividendLatin America & Caribbean Latin America & Caribbean (excluding high income)Latin America & the Caribbean (IDA & IBRD countries)LatviaLeast developed countries: UN classificationLebanonLesothoLiberiaLibyaLithuaniaLow & middle incomeLow incomeLower middle incomeLuxembourgMacao SAR, ChinaMacedonia, FYRMadagascarMalawiMalaysiaMaldivesMaliMaltaMauritaniaMauritiusMexicoMiddle East & North AfricaMiddle East & North Africa (excluding high income)Middle East & North Africa (IDA & IBRD countries)Middle incomeMoldovaMongoliaMoroccoMozambiqueMyanmarNamibiaNepalNetherlandsNew CaledoniaNew ZealandNicaraguaNigerNigeriaNorth AmericaNorwayOECD membersOmanOther small statesPacific island small statesPakistanPalauPanamaPapua New GuineaParaguayPeruPhilippinesPolandPortugalPost-demographic dividendPre-demographic dividendQatarRomaniaRussian FederationRwandaSamoaSao Tome and PrincipeSaudi ArabiaSenegalSerbiaSeychellesSierra LeoneSingaporeSlovak RepublicSloveniaSmall statesSolomon IslandsSomaliaSouth AfricaSouth AsiaSouth Asia (IDA & IBRD)SpainSri LankaSt. Kitts and NevisSt. LuciaSt. Vincent and the GrenadinesSub-Saharan Africa Sub-Saharan Africa (excluding high income)Sub-Saharan Africa (IDA & IBRD countries)SudanSurinameSwazilandSwedenSwitzerlandSyrian Arab RepublicTajikistanTanzaniaThailandTimor-LesteTogoTongaTrinidad and TobagoTunisiaTurkeyTurkmenistanTurks and Caicos IslandsTuvaluUgandaUkraineUnited Arab EmiratesUnited KingdomUnited StatesUpper middle incomeUruguayVanuatuVenezuela, RBVietnamVirgin Islands (U.S.)WorldYemen, Rep.ZambiaZimbabwe Timeline:
This timeline shows a graph from 1963 to 2016 of Ecuador. No data until 1962. Number of actual observations by date: 53.
Source name:
World Development Indicators
Source organization:
World Bank staff estimates from the Comtrade database maintained by the United Nations Statistics Division.
Categories, topics:
Private Sector, Trade
Last updated:
apr 23, 2017
Indicators value changes by year
Maximum:
13.289
jan 1, 1967
At the date of observation
Value
Absolute change
Change from previous value
jan 1, 1963
13.199
+13.199
0.0%
jan 1, 1964
9.791
-3.408
-25.82%
jan 1, 1965
12.167
+2.376
24.27%
jan 1, 1966
10.353
-1.814
-14.91%
jan 1, 1967
13.289
+2.936
28.36%
jan 1, 1968
11.012
-2.276
-17.13%
jan 1, 1969
9.267
-1.745
-15.85%
jan 1, 1970
8.099
-1.168
-12.6%
jan 1, 1971
7.919
-0.18
-2.23%
jan 1, 1972
6.767
-1.152
-14.54%
jan 1, 1973
9.308
+2.541
37.55%
jan 1, 1974
9.673
+0.365
3.92%
jan 1, 1975
8.776
-0.897
-9.27%
jan 1, 1976
8.389
-0.387
-4.41%
jan 1, 1977
8.316
-0.073
-0.87%
jan 1, 1978
7.229
-1.088
-13.08%
jan 1, 1979
7.807
+0.579
8.01%
jan 1, 1981
8.388
+0.58
7.43%
jan 1, 1982
6.434
-1.954
-23.29%
jan 1, 1983
5.079
-1.355
-21.06%
jan 1, 1984
10.452
+5.373
105.79%
jan 1, 1985
11.493
+1.041
9.96%
jan 1, 1986
8.152
-3.341
-29.07%
jan 1, 1987
4.785
-3.368
-41.31%
jan 1, 1988
6.466
+1.682
35.15%
jan 1, 1989
7.367
+0.9
13.93%
jan 1, 1990
8.739
+1.372
18.62%
jan 1, 1991
8.659
-0.08
-0.91%
jan 1, 1992
7.67
-0.989
-11.42%
jan 1, 1993
5.033
-2.638
-34.39%
jan 1, 1994
5.101
+0.068
1.35%
jan 1, 1995
6.376
+1.275
25.0%
jan 1, 1996
7.572
+1.196
18.76%
jan 1, 1997
9.945
+2.373
31.34%
jan 1, 1998
9.388
-0.556
-5.6%
jan 1, 1999
12.002
+2.614
27.84%
jan 1, 2000
10.742
-1.26
-10.5%
jan 1, 2001
9.004
-1.738
-16.18%
jan 1, 2002
8.056
-0.948
-10.53%
jan 1, 2003
8.683
+0.627
7.79%
jan 1, 2004
9.223
+0.539
6.21%
jan 1, 2005
8.953
-0.269
-2.92%
jan 1, 2006
8.031
-0.922
-10.3%
jan 1, 2007
7.061
-0.97
-12.08%
jan 1, 2008
8.435
+1.374
19.46%
jan 1, 2009
8.966
+0.531
6.3%
jan 1, 2010
9.467
+0.5
5.58%
jan 1, 2011
8.344
-1.123
-11.86%
jan 1, 2012
8.606
+0.262
3.14%
jan 1, 2013
7.774
-0.832
-9.67%
jan 1, 2014
7.303
-0.471
-6.06%
jan 1, 2015
7.719
+0.417
5.71%
jan 1, 2016
8.759
+1.04
13.47%
Ranking of countries by current statistics by years


Comments: