29
/
en
AIzaSyAYiBZKx7MnpbEhh9jyipgxe19OcubqV5w
April 1, 2024
194203
Mauritius
MUS
true
2
1
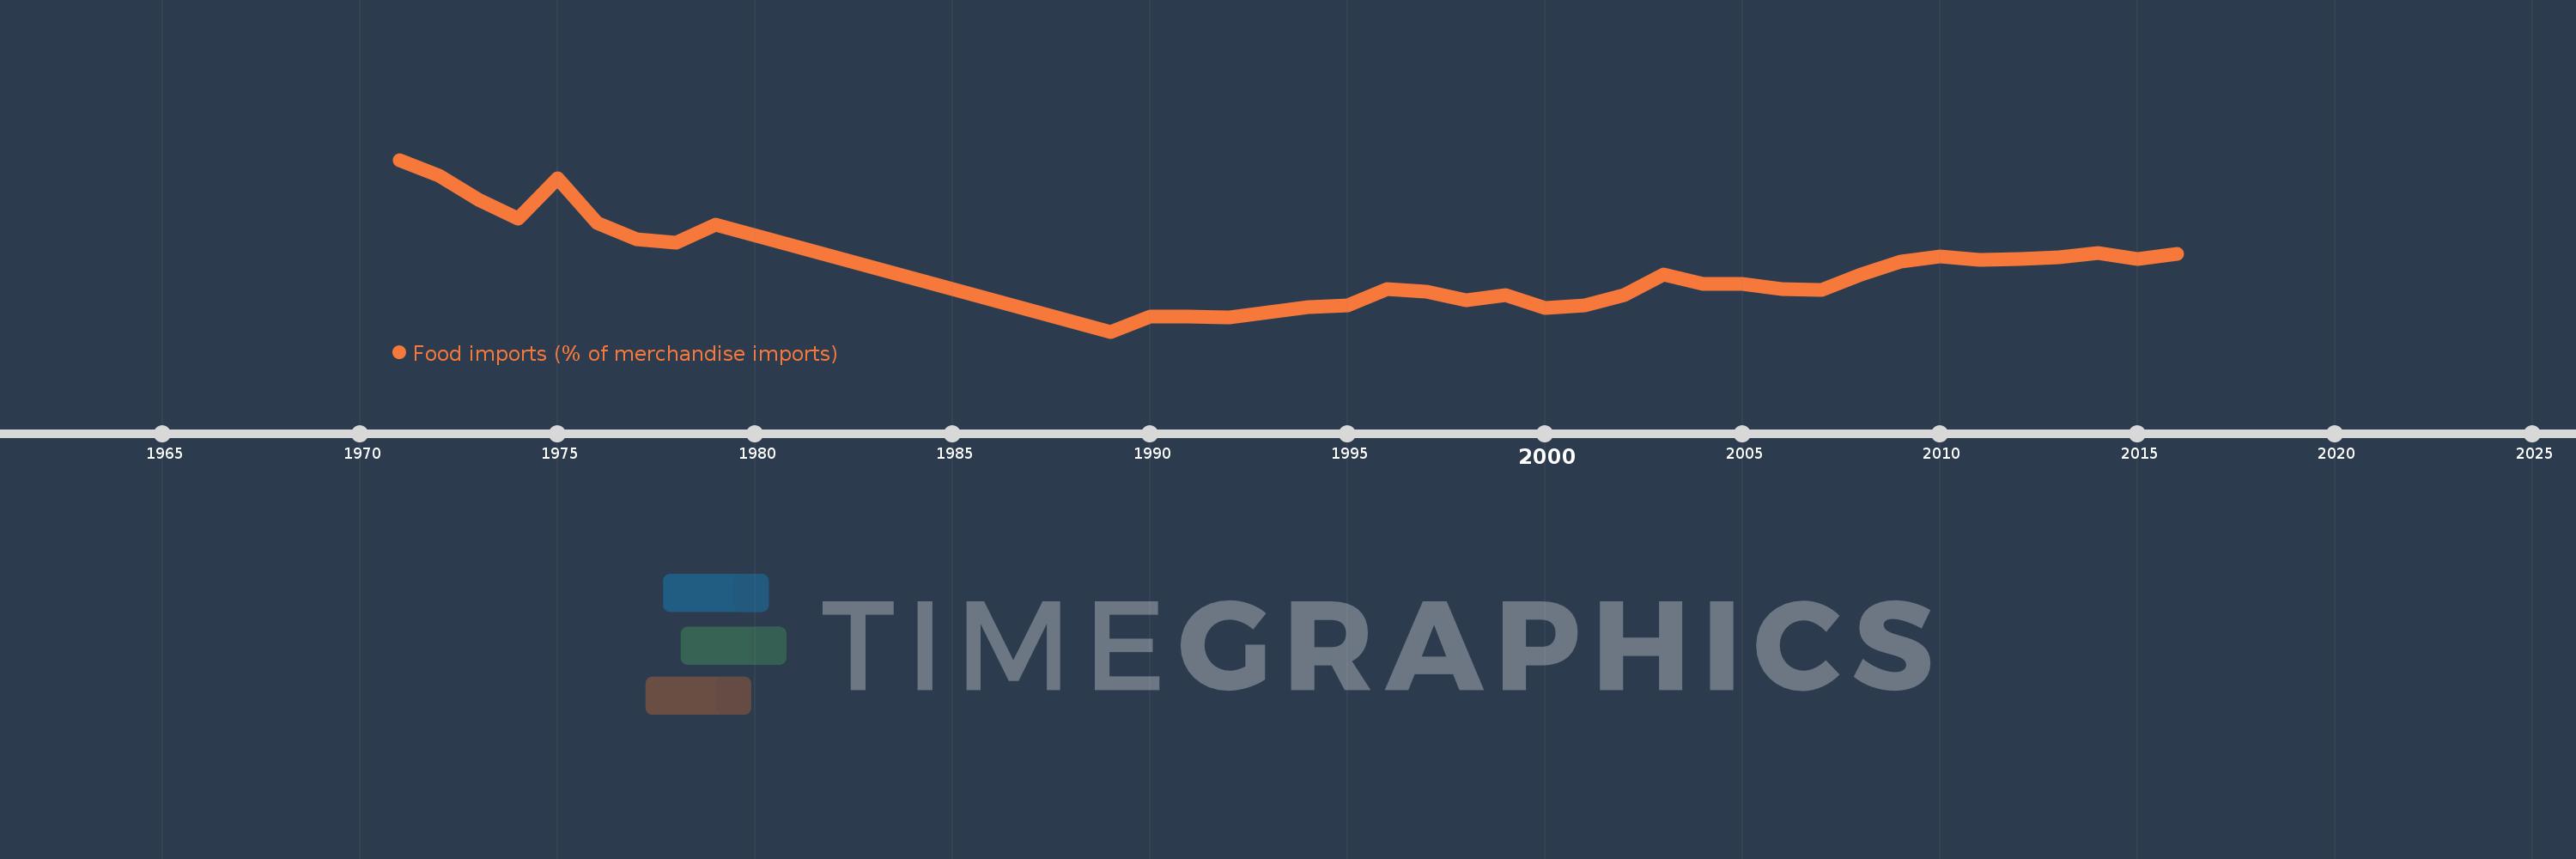
Food imports (% of merchandise imports)
2016,2015,2014,2013,2012,2011,2010,2009,2008,2007,2006,2005,2004,2003,2002,2001,2000,1999,1998,1997,1996,1995,1994,1993,1992,1991,1990,1989,1979,1978,1977,1976,1975,1974,1973,1972,1971
This statistics in other country:
AfghanistanAlbaniaAlgeriaAndorraAngolaAntigua and BarbudaArab WorldArgentinaArmeniaArubaAustraliaAustriaAzerbaijanBahamas, TheBahrainBangladeshBarbadosBelarusBelgiumBelizeBeninBermudaBhutanBoliviaBosnia and HerzegovinaBotswanaBrazilBrunei DarussalamBulgariaBurkina FasoBurundiCabo VerdeCambodiaCameroonCanadaCaribbean small statesCayman IslandsCentral African RepublicCentral Europe and the BalticsChadChileChinaColombiaComorosCongo, Dem. Rep.Congo, Rep.Costa RicaCote d'IvoireCroatiaCubaCyprusCzech RepublicDenmarkDjiboutiDominicaDominican RepublicEarly-demographic dividendEast Asia & PacificEast Asia & Pacific (excluding high income)East Asia & Pacific (IDA & IBRD countries)EcuadorEgypt, Arab Rep.El SalvadorEquatorial GuineaEritreaEstoniaEthiopiaEuro areaEurope & Central AsiaEurope & Central Asia (excluding high income)Europe & Central Asia (IDA & IBRD countries)European UnionFaroe IslandsFijiFinlandFragile and conflict affected situationsFranceFrench PolynesiaGabonGambia, TheGeorgiaGermanyGhanaGreeceGreenlandGrenadaGuatemalaGuineaGuinea-BissauGuyanaHaitiHeavily indebted poor countries (HIPC)High incomeHondurasHong Kong SAR, ChinaHungaryIBRD onlyIcelandIDA & IBRD totalIDA blendIDA onlyIDA totalIndiaIndonesiaIran, Islamic Rep.IraqIrelandIsraelItalyJamaicaJapanJordanKazakhstanKenyaKiribatiKorea, Rep.KuwaitKyrgyz RepublicLao PDRLate-demographic dividendLatin America & Caribbean Latin America & Caribbean (excluding high income)Latin America & the Caribbean (IDA & IBRD countries)LatviaLeast developed countries: UN classificationLebanonLesothoLiberiaLibyaLithuaniaLow & middle incomeLow incomeLower middle incomeLuxembourgMacao SAR, ChinaMacedonia, FYRMadagascarMalawiMalaysiaMaldivesMaliMaltaMauritaniaMauritiusMexicoMiddle East & North AfricaMiddle East & North Africa (excluding high income)Middle East & North Africa (IDA & IBRD countries)Middle incomeMoldovaMongoliaMoroccoMozambiqueMyanmarNamibiaNepalNetherlandsNew CaledoniaNew ZealandNicaraguaNigerNigeriaNorth AmericaNorwayOECD membersOmanOther small statesPacific island small statesPakistanPalauPanamaPapua New GuineaParaguayPeruPhilippinesPolandPortugalPost-demographic dividendPre-demographic dividendQatarRomaniaRussian FederationRwandaSamoaSao Tome and PrincipeSaudi ArabiaSenegalSerbiaSeychellesSierra LeoneSingaporeSlovak RepublicSloveniaSmall statesSolomon IslandsSomaliaSouth AfricaSouth AsiaSouth Asia (IDA & IBRD)SpainSri LankaSt. Kitts and NevisSt. LuciaSt. Vincent and the GrenadinesSub-Saharan Africa Sub-Saharan Africa (excluding high income)Sub-Saharan Africa (IDA & IBRD countries)SudanSurinameSwazilandSwedenSwitzerlandSyrian Arab RepublicTajikistanTanzaniaThailandTimor-LesteTogoTongaTrinidad and TobagoTunisiaTurkeyTurkmenistanTurks and Caicos IslandsTuvaluUgandaUkraineUnited Arab EmiratesUnited KingdomUnited StatesUpper middle incomeUruguayVanuatuVenezuela, RBVietnamVirgin Islands (U.S.)WorldYemen, Rep.ZambiaZimbabwe Timeline:
This timeline shows a graph from 1971 to 2016 of Mauritius. No data until 1970. Number of actual observations by date: 37.
Source name:
World Development Indicators
Source organization:
World Bank staff estimates from the Comtrade database maintained by the United Nations Statistics Division.
Categories, topics:
Private Sector, Trade
Last updated:
apr 23, 2017
Indicators value changes by year
Minimum:
10.225
jan 1, 1989
Maximum:
36.364
jan 1, 1971
At the date of observation
Value
Absolute change
Change from previous value
jan 1, 1971
36.364
+36.364
0.0%
jan 1, 1972
33.994
-2.371
-6.52%
jan 1, 1973
30.272
-3.722
-10.95%
jan 1, 1974
27.453
-2.818
-9.31%
jan 1, 1975
33.547
+6.093
22.2%
jan 1, 1976
26.71
-6.836
-20.38%
jan 1, 1977
24.227
-2.483
-9.3%
jan 1, 1978
23.732
-0.496
-2.05%
jan 1, 1979
26.454
+2.722
11.47%
jan 1, 1989
10.225
-16.229
-61.35%
jan 1, 1990
12.527
+2.302
22.52%
jan 1, 1991
12.464
-0.063
-0.51%
jan 1, 1992
12.379
-0.085
-0.68%
jan 1, 1993
13.164
+0.785
6.34%
jan 1, 1994
13.938
+0.774
5.88%
jan 1, 1995
14.256
+0.318
2.28%
jan 1, 1996
16.737
+2.481
17.4%
jan 1, 1997
16.362
-0.374
-2.24%
jan 1, 1998
15.023
-1.339
-8.18%
jan 1, 1999
15.789
+0.766
5.1%
jan 1, 2000
13.804
-1.985
-12.57%
jan 1, 2001
14.253
+0.449
3.25%
jan 1, 2002
15.775
+1.522
10.68%
jan 1, 2003
18.981
+3.206
20.32%
jan 1, 2004
17.484
-1.497
-7.89%
jan 1, 2005
17.543
+0.059
0.34%
jan 1, 2006
16.705
-0.838
-4.78%
jan 1, 2007
16.506
-0.199
-1.19%
jan 1, 2008
18.887
+2.381
14.42%
jan 1, 2009
20.901
+2.015
10.67%
jan 1, 2010
21.615
+0.713
3.41%
jan 1, 2011
21.093
-0.522
-2.42%
jan 1, 2012
21.314
+0.221
1.05%
jan 1, 2013
21.583
+0.269
1.26%
jan 1, 2014
22.129
+0.546
2.53%
jan 1, 2015
21.269
-0.86
-3.89%
jan 1, 2016
22.065
+0.797
3.75%
Ranking of countries by current statistics by years


Comments: