29
/
en
AIzaSyAYiBZKx7MnpbEhh9jyipgxe19OcubqV5w
April 1, 2024
72710
Australia
AUS
true
2
1
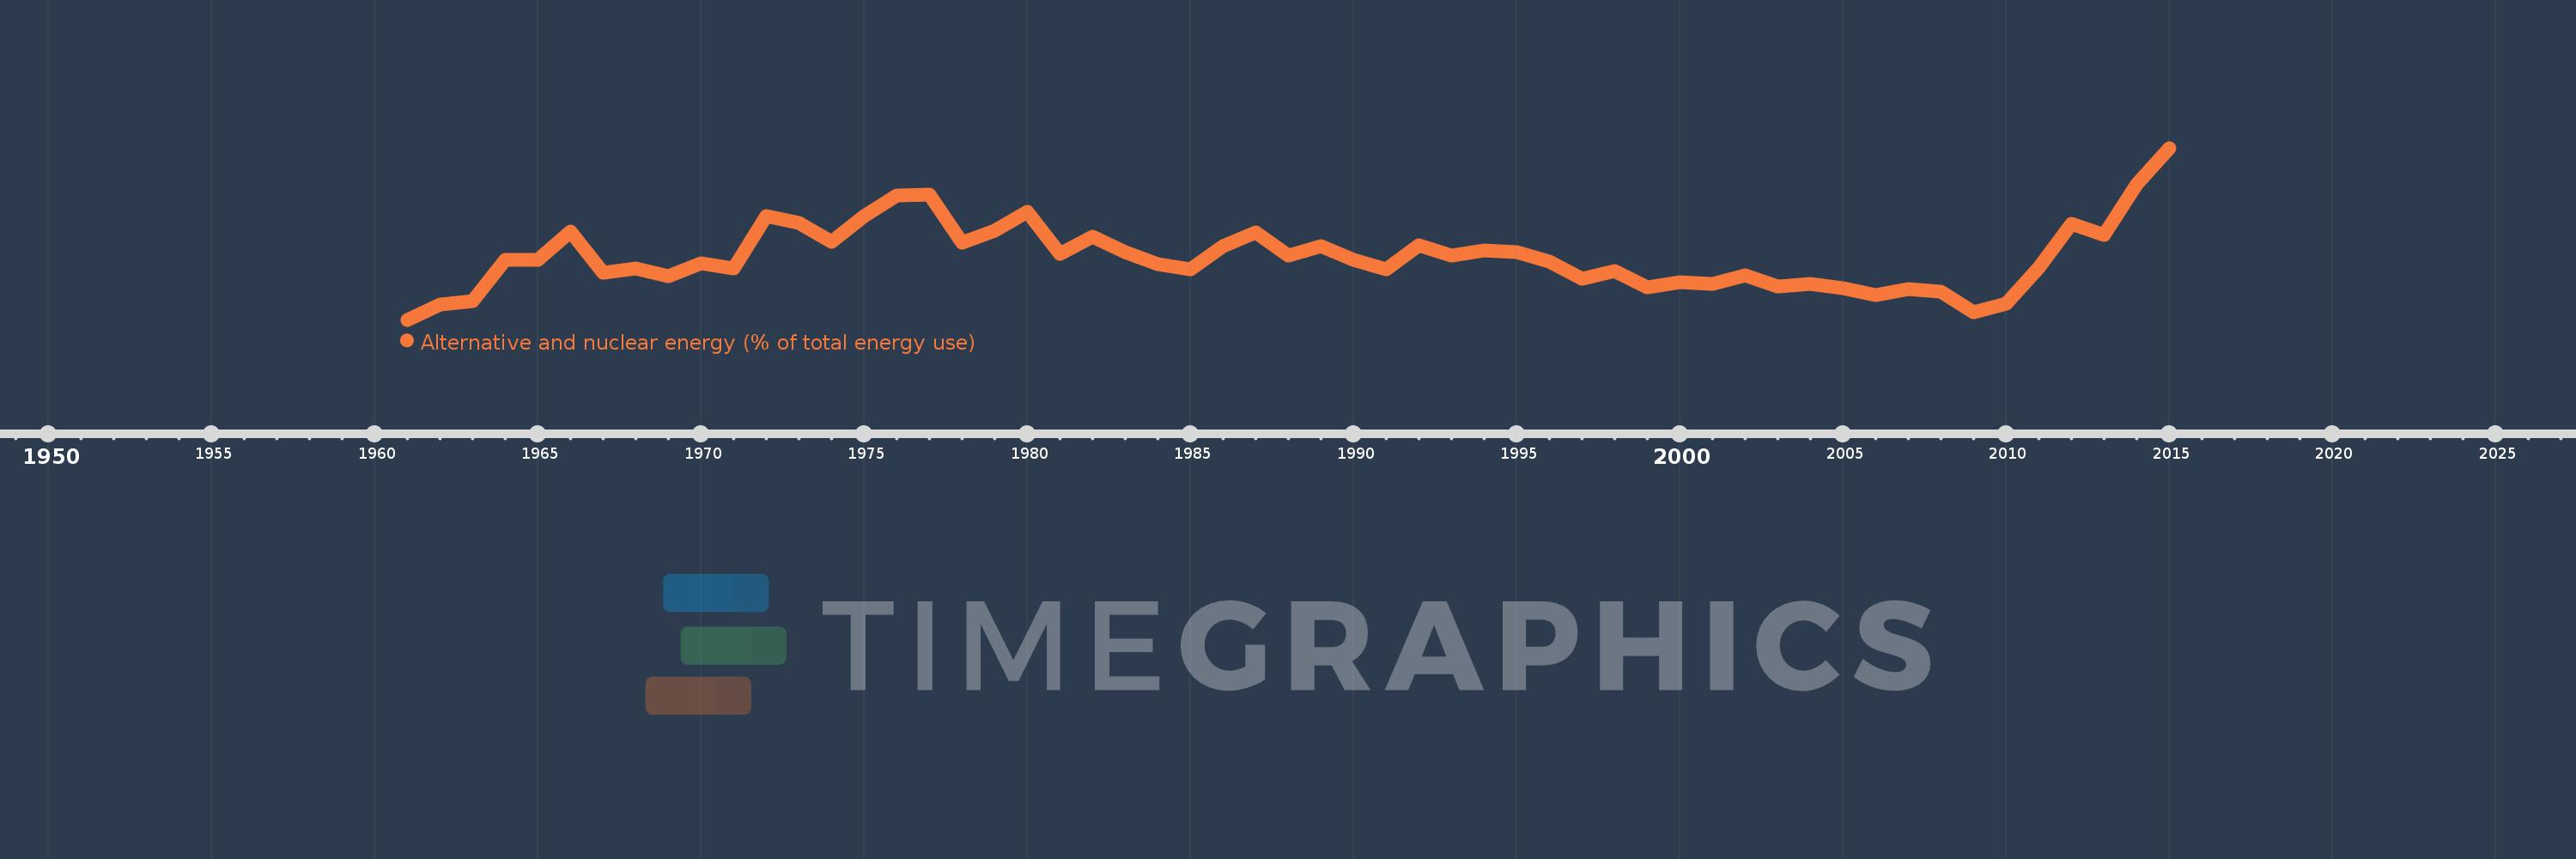
Alternative and nuclear energy (% of total energy use)
2015,2014,2013,2012,2011,2010,2009,2008,2007,2006,2005,2004,2003,2002,2001,2000,1999,1998,1997,1996,1995,1994,1993,1992,1991,1990,1989,1988,1987,1986,1985,1984,1983,1982,1981,1980,1979,1978,1977,1976,1975,1974,1973,1972,1971,1970,1969,1968,1967,1966,1965,1964,1963,1962,1961
This statistics in other country:
AlbaniaAlgeriaAngolaArab WorldArgentinaArmeniaAustraliaAustriaAzerbaijanBahrainBangladeshBelarusBelgiumBeninBoliviaBosnia and HerzegovinaBotswanaBrazilBrunei DarussalamBulgariaCambodiaCameroonCanadaCaribbean small statesCentral Europe and the BalticsChileChinaColombiaCongo, Dem. Rep.Congo, Rep.Costa RicaCote d'IvoireCroatiaCubaCuracaoCyprusCzech RepublicDenmarkDominican RepublicEarly-demographic dividendEast Asia & PacificEast Asia & Pacific (excluding high income)East Asia & Pacific (IDA & IBRD countries)EcuadorEgypt, Arab Rep.El SalvadorEritreaEstoniaEthiopiaEuro areaEurope & Central AsiaEurope & Central Asia (excluding high income)Europe & Central Asia (IDA & IBRD countries)European UnionFinlandFragile and conflict affected situationsFranceGabonGeorgiaGermanyGhanaGibraltarGreeceGuatemalaHaitiHeavily indebted poor countries (HIPC)High incomeHondurasHong Kong SAR, ChinaHungaryIBRD onlyIcelandIDA & IBRD totalIDA blendIDA onlyIDA totalIndiaIndonesiaIran, Islamic Rep.IraqIrelandIsraelItalyJamaicaJapanJordanKazakhstanKenyaKorea, Dem. People’s Rep.Korea, Rep.KosovoKuwaitKyrgyz RepublicLate-demographic dividendLatin America & Caribbean Latin America & Caribbean (excluding high income)Latin America & the Caribbean (IDA & IBRD countries)LatviaLeast developed countries: UN classificationLebanonLibyaLithuaniaLow & middle incomeLow incomeLower middle incomeLuxembourgMacedonia, FYRMalaysiaMaltaMauritiusMexicoMiddle East & North AfricaMiddle East & North Africa (excluding high income)Middle East & North Africa (IDA & IBRD countries)Middle incomeMoldovaMongoliaMontenegroMoroccoMozambiqueMyanmarNamibiaNepalNetherlandsNew ZealandNicaraguaNigerNigeriaNorth AmericaNorwayOECD membersOmanOther small statesPakistanPanamaParaguayPeruPhilippinesPolandPortugalPost-demographic dividendPre-demographic dividendQatarRomaniaRussian FederationSaudi ArabiaSenegalSerbiaSingaporeSlovak RepublicSloveniaSmall statesSouth AfricaSouth AsiaSouth Asia (IDA & IBRD)South SudanSpainSri LankaSub-Saharan Africa Sub-Saharan Africa (excluding high income)Sub-Saharan Africa (IDA & IBRD countries)SudanSwedenSwitzerlandSyrian Arab RepublicTajikistanTanzaniaThailandTogoTrinidad and TobagoTunisiaTurkeyTurkmenistanUkraineUnited Arab EmiratesUnited KingdomUnited StatesUpper middle incomeUruguayUzbekistanVenezuela, RBVietnamWorldYemen, Rep.ZambiaZimbabwe Timeline:
This timeline shows a graph from 1961 to 2015 of Australia. No data until 1960. Number of actual observations by date: 55.
Source name:
World Development Indicators
Source organization:
IEA Statistics © OECD/IEA 2014 (http://www.iea.org/stats/index.asp), subject to https://www.iea.org/t&c/termsandconditions/
Categories, topics:
Energy & Mining
Last updated:
apr 23, 2017
Indicators value changes by year
At the date of observation
Value
Absolute change
Change from previous value
jan 1, 1961
1.092
+1.092
0.0%
jan 1, 1962
1.217
+0.125
11.41%
jan 1, 1963
1.241
+0.024
1.97%
jan 1, 1964
1.578
+0.338
27.21%
jan 1, 1965
1.573
-0.005
-0.35%
jan 1, 1966
1.808
+0.236
14.98%
jan 1, 1967
1.47
-0.338
-18.7%
jan 1, 1968
1.504
+0.034
2.33%
jan 1, 1969
1.447
-0.057
-3.79%
jan 1, 1970
1.548
+0.1
6.94%
jan 1, 1971
1.504
-0.044
-2.84%
jan 1, 1972
1.93
+0.426
28.3%
jan 1, 1973
1.872
-0.058
-3.0%
jan 1, 1974
1.72
-0.152
-8.11%
jan 1, 1975
1.931
+0.211
12.26%
jan 1, 1976
2.097
+0.166
8.61%
jan 1, 1977
2.103
+0.006
0.28%
jan 1, 1978
1.715
-0.388
-18.44%
jan 1, 1979
1.81
+0.095
5.53%
jan 1, 1980
1.964
+0.154
8.52%
jan 1, 1981
1.627
-0.337
-17.17%
jan 1, 1982
1.763
+0.135
8.33%
jan 1, 1983
1.641
-0.122
-6.92%
jan 1, 1984
1.543
-0.097
-5.93%
jan 1, 1985
1.497
-0.046
-2.99%
jan 1, 1986
1.689
+0.192
12.83%
jan 1, 1987
1.796
+0.107
6.34%
jan 1, 1988
1.611
-0.185
-10.3%
jan 1, 1989
1.686
+0.075
4.64%
jan 1, 1990
1.575
-0.111
-6.59%
jan 1, 1991
1.503
-0.072
-4.59%
jan 1, 1992
1.692
+0.189
12.61%
jan 1, 1993
1.614
-0.078
-4.63%
jan 1, 1994
1.653
+0.039
2.42%
jan 1, 1995
1.637
-0.016
-0.96%
jan 1, 1996
1.562
-0.075
-4.6%
jan 1, 1997
1.425
-0.137
-8.78%
jan 1, 1998
1.483
+0.059
4.13%
jan 1, 1999
1.353
-0.13
-8.77%
jan 1, 2000
1.393
+0.04
2.97%
jan 1, 2001
1.385
-0.009
-0.63%
jan 1, 2002
1.449
+0.065
4.68%
jan 1, 2003
1.36
-0.089
-6.16%
jan 1, 2004
1.382
+0.022
1.63%
jan 1, 2005
1.344
-0.038
-2.76%
jan 1, 2006
1.289
-0.056
-4.14%
jan 1, 2007
1.34
+0.051
3.99%
jan 1, 2008
1.318
-0.021
-1.6%
jan 1, 2009
1.153
-0.165
-12.55%
jan 1, 2010
1.223
+0.07
6.09%
jan 1, 2011
1.513
+0.29
23.73%
jan 1, 2012
1.866
+0.353
23.31%
jan 1, 2013
1.779
-0.087
-4.66%
jan 1, 2014
2.19
+0.411
23.1%
jan 1, 2015
2.481
+0.291
13.28%
Ranking of countries by current statistics by years


Comments: