29
/
en
AIzaSyAYiBZKx7MnpbEhh9jyipgxe19OcubqV5w
April 1, 2024
201231
Morocco
MAR
true
2
1
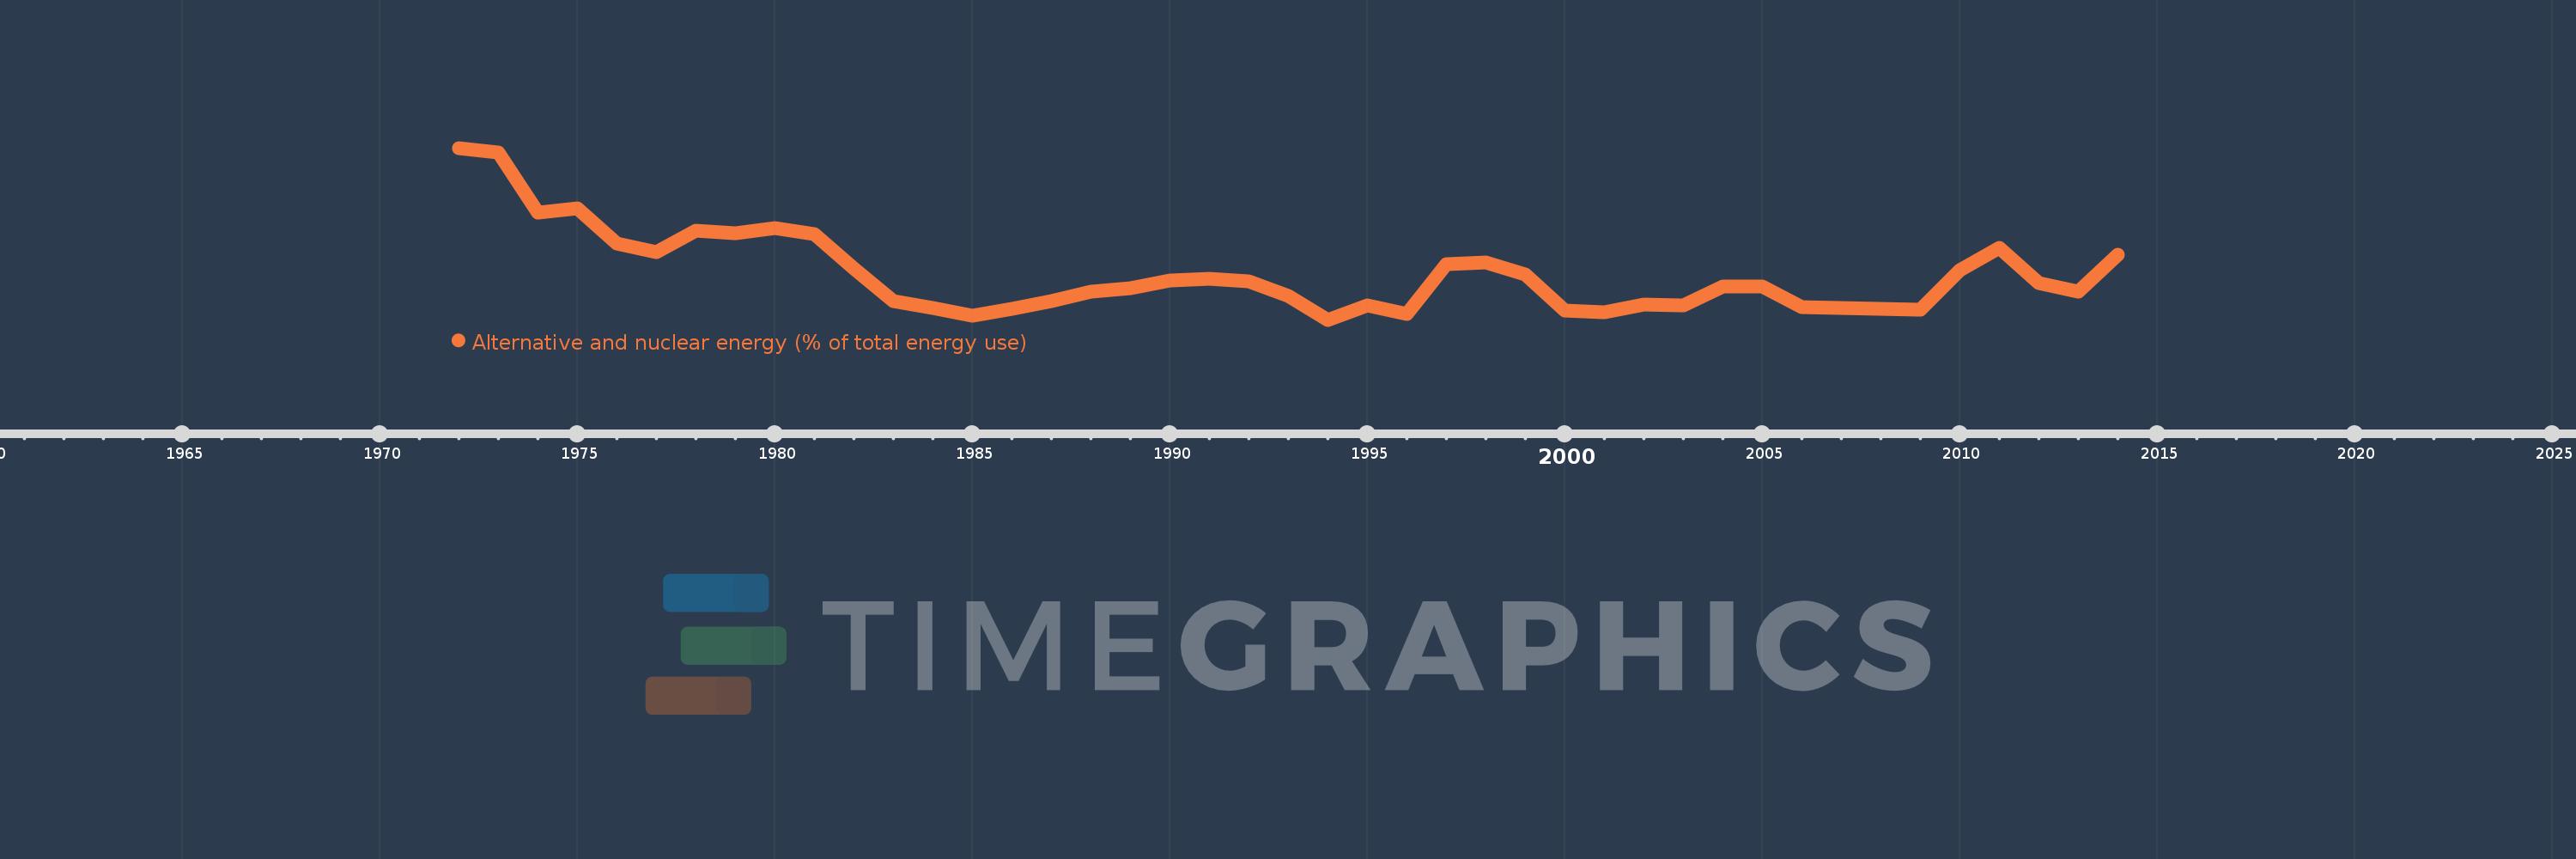
Alternative and nuclear energy (% of total energy use)
2014,2013,2012,2011,2010,2009,2008,2007,2006,2005,2004,2003,2002,2001,2000,1999,1998,1997,1996,1995,1994,1993,1992,1991,1990,1989,1988,1987,1986,1985,1984,1983,1982,1981,1980,1979,1978,1977,1976,1975,1974,1973,1972
This statistics in other country:
AlbaniaAlgeriaAngolaArab WorldArgentinaArmeniaAustraliaAustriaAzerbaijanBahrainBangladeshBelarusBelgiumBeninBoliviaBosnia and HerzegovinaBotswanaBrazilBrunei DarussalamBulgariaCambodiaCameroonCanadaCaribbean small statesCentral Europe and the BalticsChileChinaColombiaCongo, Dem. Rep.Congo, Rep.Costa RicaCote d'IvoireCroatiaCubaCuracaoCyprusCzech RepublicDenmarkDominican RepublicEarly-demographic dividendEast Asia & PacificEast Asia & Pacific (excluding high income)East Asia & Pacific (IDA & IBRD countries)EcuadorEgypt, Arab Rep.El SalvadorEritreaEstoniaEthiopiaEuro areaEurope & Central AsiaEurope & Central Asia (excluding high income)Europe & Central Asia (IDA & IBRD countries)European UnionFinlandFragile and conflict affected situationsFranceGabonGeorgiaGermanyGhanaGibraltarGreeceGuatemalaHaitiHeavily indebted poor countries (HIPC)High incomeHondurasHong Kong SAR, ChinaHungaryIBRD onlyIcelandIDA & IBRD totalIDA blendIDA onlyIDA totalIndiaIndonesiaIran, Islamic Rep.IraqIrelandIsraelItalyJamaicaJapanJordanKazakhstanKenyaKorea, Dem. People’s Rep.Korea, Rep.KosovoKuwaitKyrgyz RepublicLate-demographic dividendLatin America & Caribbean Latin America & Caribbean (excluding high income)Latin America & the Caribbean (IDA & IBRD countries)LatviaLeast developed countries: UN classificationLebanonLibyaLithuaniaLow & middle incomeLow incomeLower middle incomeLuxembourgMacedonia, FYRMalaysiaMaltaMauritiusMexicoMiddle East & North AfricaMiddle East & North Africa (excluding high income)Middle East & North Africa (IDA & IBRD countries)Middle incomeMoldovaMongoliaMontenegroMoroccoMozambiqueMyanmarNamibiaNepalNetherlandsNew ZealandNicaraguaNigerNigeriaNorth AmericaNorwayOECD membersOmanOther small statesPakistanPanamaParaguayPeruPhilippinesPolandPortugalPost-demographic dividendPre-demographic dividendQatarRomaniaRussian FederationSaudi ArabiaSenegalSerbiaSingaporeSlovak RepublicSloveniaSmall statesSouth AfricaSouth AsiaSouth Asia (IDA & IBRD)South SudanSpainSri LankaSub-Saharan Africa Sub-Saharan Africa (excluding high income)Sub-Saharan Africa (IDA & IBRD countries)SudanSwedenSwitzerlandSyrian Arab RepublicTajikistanTanzaniaThailandTogoTrinidad and TobagoTunisiaTurkeyTurkmenistanUkraineUnited Arab EmiratesUnited KingdomUnited StatesUpper middle incomeUruguayUzbekistanVenezuela, RBVietnamWorldYemen, Rep.ZambiaZimbabwe Timeline:
This timeline shows a graph from 1972 to 2014 of Morocco. No data until 1971. Number of actual observations by date: 43.
Source name:
World Development Indicators
Source organization:
IEA Statistics © OECD/IEA 2014 (http://www.iea.org/stats/index.asp), subject to https://www.iea.org/t&c/termsandconditions/
Categories, topics:
Energy & Mining
Last updated:
apr 23, 2017
Indicators value changes by year
At the date of observation
Value
Absolute change
Change from previous value
jan 1, 1972
4.414
+4.414
0.0%
jan 1, 1973
4.306
-0.108
-2.45%
jan 1, 1974
2.906
-1.401
-32.53%
jan 1, 1975
3.006
+0.101
3.47%
jan 1, 1976
2.204
-0.802
-26.68%
jan 1, 1977
2.004
-0.2
-9.08%
jan 1, 1978
2.492
+0.488
24.36%
jan 1, 1979
2.441
-0.052
-2.08%
jan 1, 1980
2.556
+0.116
4.74%
jan 1, 1981
2.41
-0.147
-5.73%
jan 1, 1982
1.622
-0.788
-32.7%
jan 1, 1983
0.87
-0.751
-46.33%
jan 1, 1984
0.704
-0.167
-19.16%
jan 1, 1985
0.519
-0.184
-26.22%
jan 1, 1986
0.676
+0.157
30.29%
jan 1, 1987
0.867
+0.191
28.25%
jan 1, 1988
1.085
+0.218
25.12%
jan 1, 1989
1.173
+0.088
8.07%
jan 1, 1990
1.335
+0.162
13.82%
jan 1, 1991
1.377
+0.042
3.12%
jan 1, 1992
1.316
-0.06
-4.37%
jan 1, 1993
0.977
-0.339
-25.76%
jan 1, 1994
0.433
-0.545
-55.72%
jan 1, 1995
0.766
+0.334
77.06%
jan 1, 1996
0.563
-0.204
-26.59%
jan 1, 1997
1.714
+1.152
204.75%
jan 1, 1998
1.77
+0.056
3.25%
jan 1, 1999
1.482
-0.289
-16.3%
jan 1, 2000
0.647
-0.835
-56.34%
jan 1, 2001
0.61
-0.037
-5.71%
jan 1, 2002
0.792
+0.182
29.92%
jan 1, 2003
0.756
-0.037
-4.65%
jan 1, 2004
1.206
+0.451
59.64%
jan 1, 2005
1.196
-0.01
-0.83%
jan 1, 2006
0.723
-0.473
-39.52%
jan 1, 2007
0.707
-0.017
-2.31%
jan 1, 2008
0.679
-0.027
-3.89%
jan 1, 2009
0.669
-0.01
-1.51%
jan 1, 2010
1.588
+0.919
137.39%
jan 1, 2011
2.096
+0.508
31.99%
jan 1, 2012
1.273
-0.824
-39.3%
jan 1, 2013
1.076
-0.196
-15.43%
jan 1, 2014
1.943
+0.867
80.55%
Ranking of countries by current statistics by years


Comments: